
Before you start
Open the intended study and identify the panel, statuses, and question values needed for the review. Editor access is required for answer corrections.Read fieldwork progress
The Respondents summary displays:
These figures measure progress toward the target. They do not count every response row. Screened-out, partial, abandoned, and low-quality records remain available in the table.
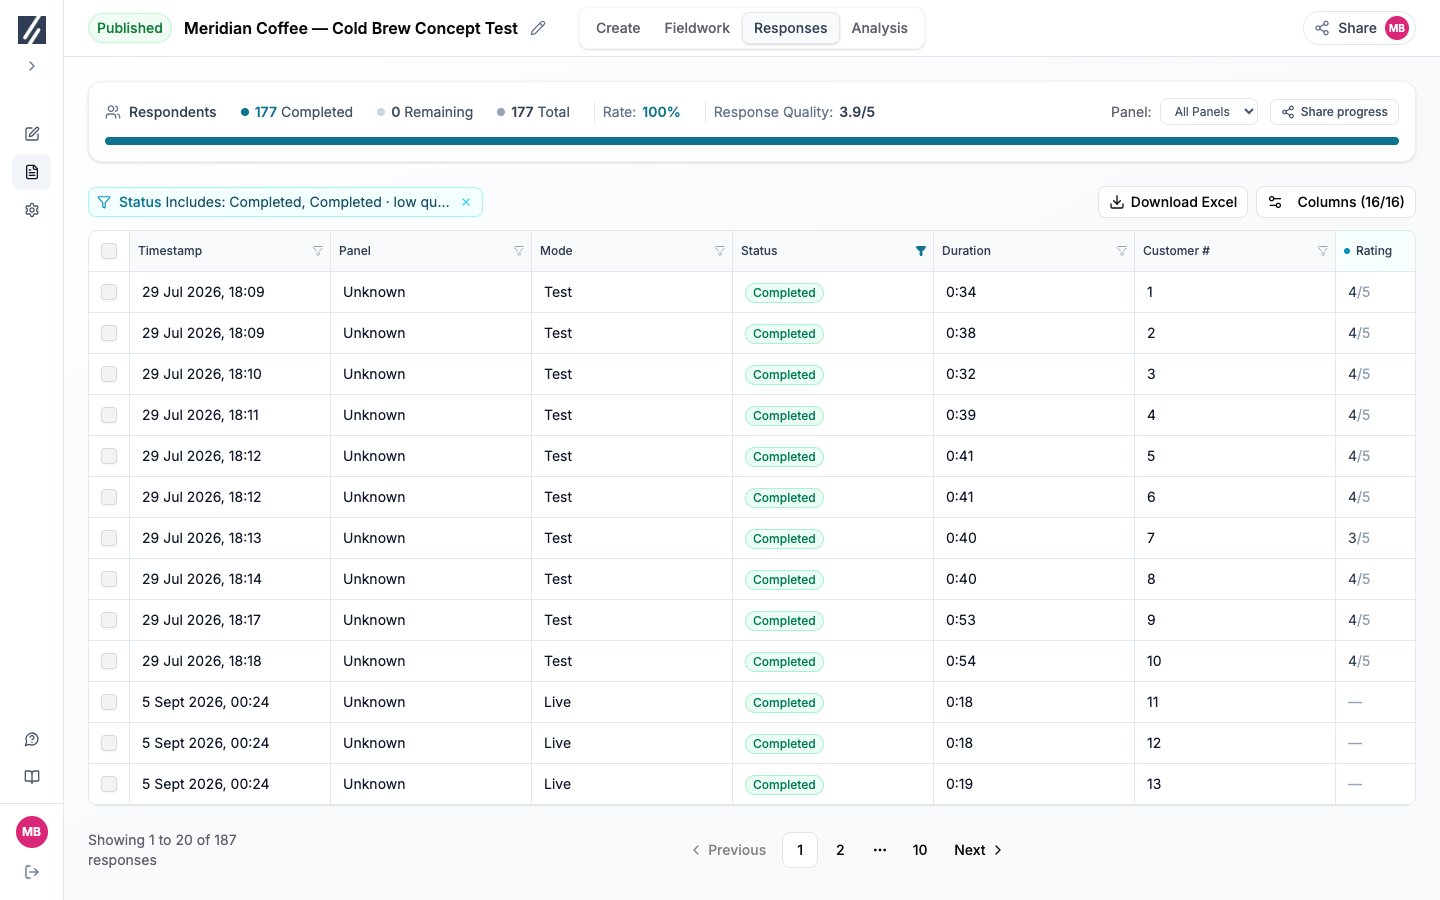
The Respondents summary measures progress against the saved panel target, while the table contains individual records.
Choose table columns
Select Columns and enable the fields required for the current review. Columns are grouped into respondent information, answers, variables, and computed fields. The table can include Timestamp, Panel, Mode, Status, Duration, Rating, Persona, question answers and labels, response metadata, variables, saved weights, and Tags when a response has one.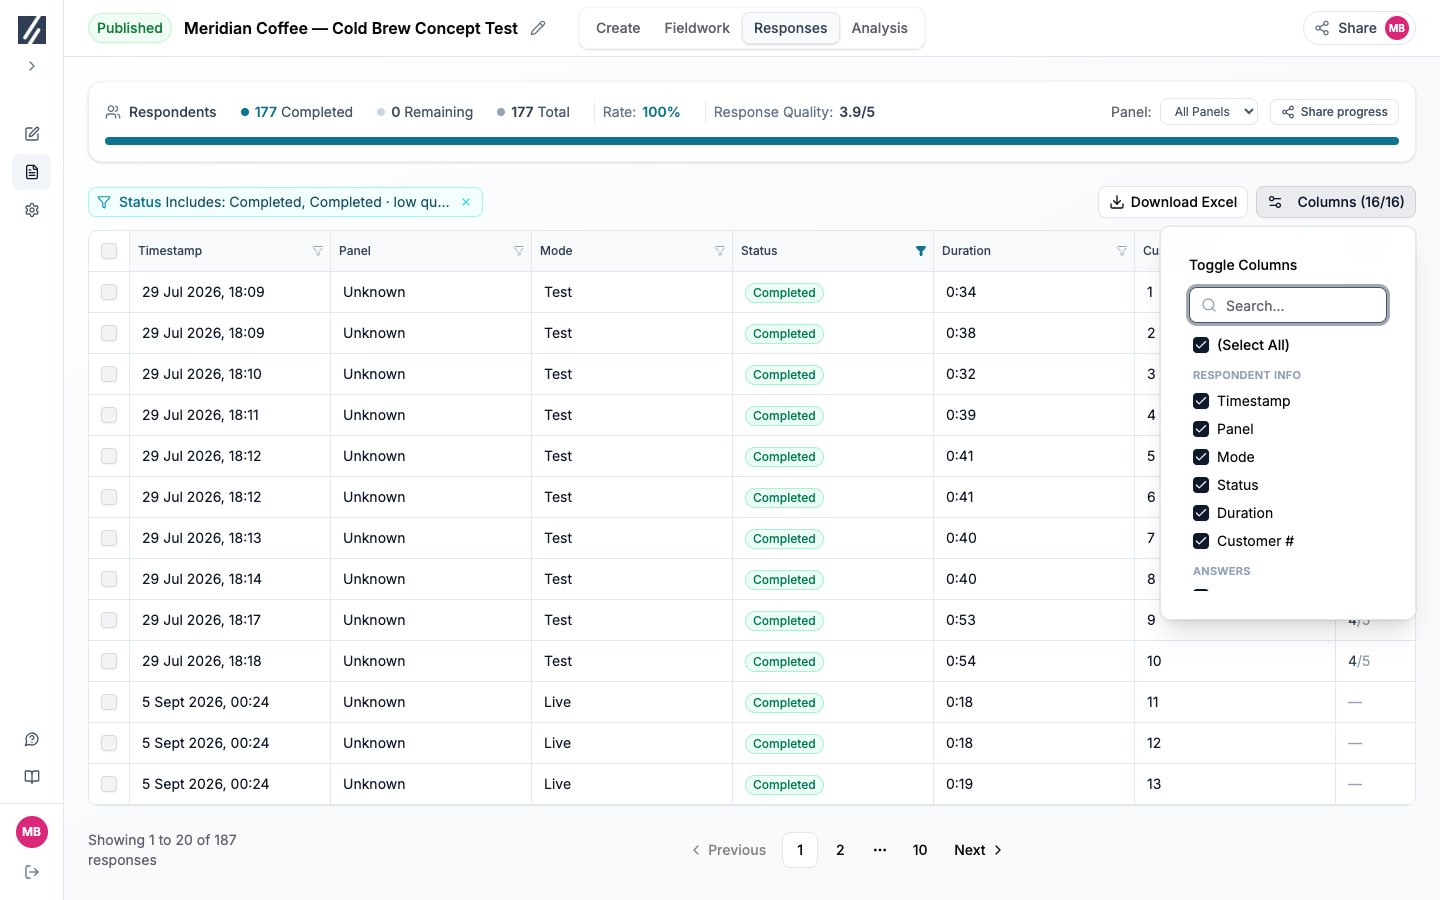
The Columns control reduces a wide response table to the fields needed for the current review.
Filter response records
Each column menu contains a value list or an operator and input. Filters on different columns apply together.
The initial Status filter includes Completed and Completed · low quality. Open it when you need Screened out, In progress, Abandoned, Not started, quota-full, or quality-stopped records.
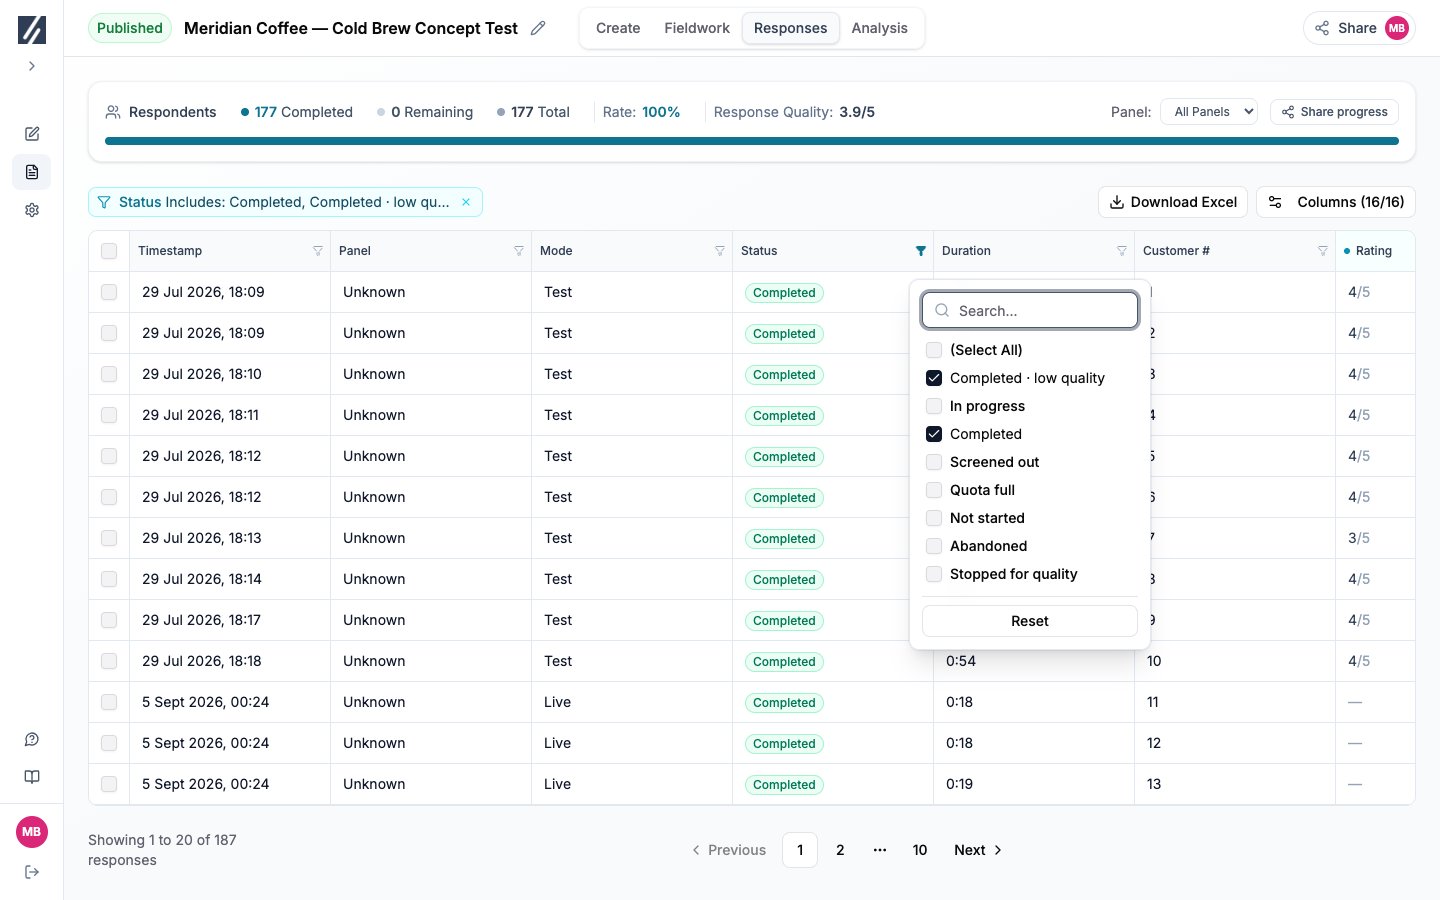
Column filters can combine a response status with a value from any question or computed field.

Keep only the source, custom answer, and variable columns to check the completed test record.
Understand statuses
Use the panel and Status filters to compare entry, screen-out, completion, and quality outcomes during fieldwork.
Open an answer or recording
Select an answer cell to view its full value. A play control beside an open-ended answer indicates an available recording. Select it to open the media and transcript for that question.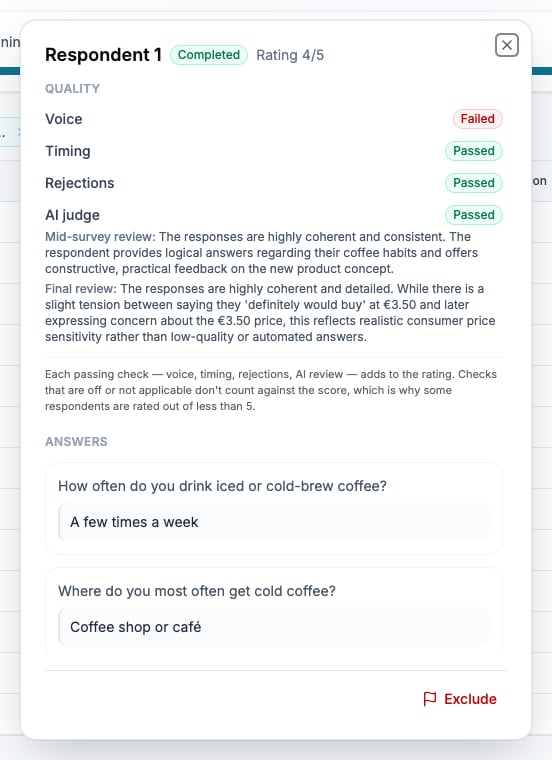
An answer opens in context with its full value, badges, and available edit or media controls.
Correct an answer
Editors can select Edit answer in the answer detail. The editor follows the question type and validates numeric ranges or available choices. After confirmation, analysis and exports use the corrected value. The detail keeps the original value and displays an Edited badge. Select Restore original to return analysis to the submitted value. Corrections do not recalculate the participant’s original screening, quota assignment, or journey.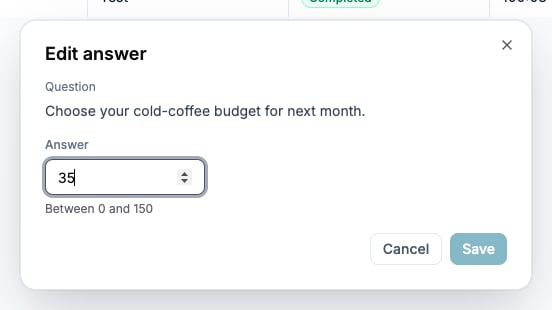
Enter the corrected value, then save and reopen the answer to verify it.
Read translated or converted values
Completed open-text responses in another language can display a Translated badge with the submitted wording available in the detail. Currency responses can display Converted with the original amount and currency. When no conversion rate is available, the original currency remains identified.Add and filter tags
Open a Tags cell and select Add tag. Choose a type or create a lowercase custom type using letters, numbers, and underscores. Add a comment when the reason should be retained. Manual tags can be edited or removed. Automatic tags, including pharmacovigilance results where configured, are read-only. The Tags column appears after at least one response has a tag.Troubleshooting
A response is missing from the table
A response is missing from the table
Reset the Status and other column filters, then set Panel to All Panels. Use a Customer number or known answer as a column filter when available.
Completed is lower than the number of finished rows
Completed is lower than the number of finished rows
Filter Status to Completed · low quality and Excluded records. The summary counts completed responses that qualify for the target and analysis.
A quota exceeded its Min
A quota exceeded its Min
Min is the target rather than the cap. Add or lower Max for any cell that must stop intake at a specific count.