
Before you start
Save pending edits. Confirm the intended deck or chart folders are open and the analysis includes the responses you need. Generate from the analysis plan if its outputs need updating.Export a deck to PowerPoint
Open Analysis → Slides, select the required deck, and save any current edits. Select Download PowerPoint to download that deck. Build the deck from a folder of verified charts (Build a deck from a folder), or create and revise it through the analysis assistant before exporting. The file contains editable presentation elements, including chart and crosstab tables. Wide or tall tables can span several slides. Generated slides use a 16:9 layout with the table title and base information; inspect every continuation slide so the column labels and data remain readable. The file is rebuilt from the saved content, so line wrapping can differ from the browser. Open it in PowerPoint and check dense text, table boundaries, chart placement, and the bases used by each result.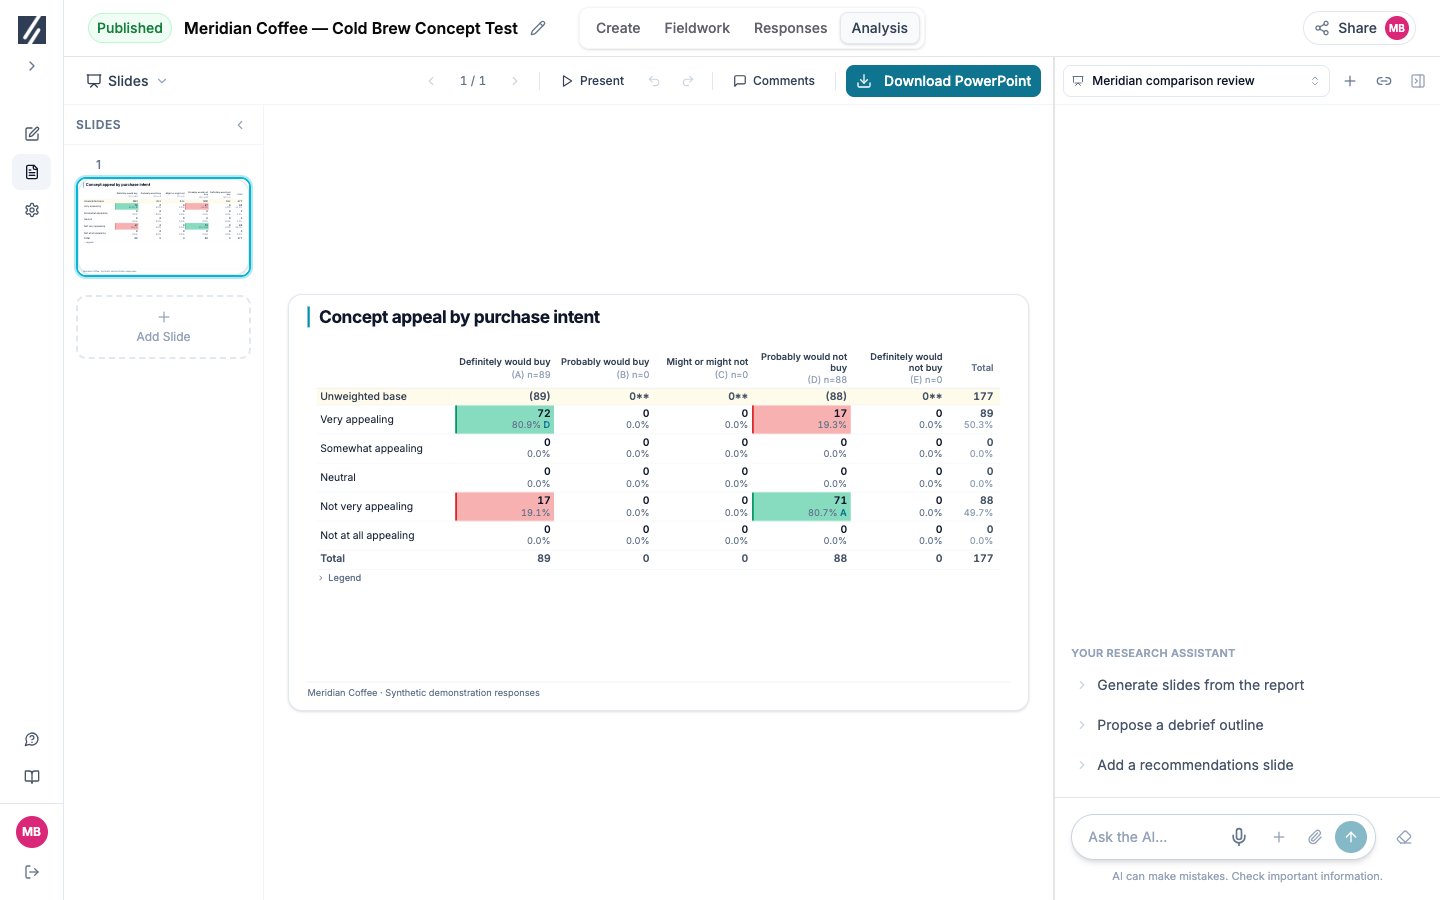
Download PowerPoint exports the deck currently open in Slides.
Export the chart library to Excel
Open Analysis → Charts → Download Excel. When the library has folders, choose which folders and ungrouped charts to include, then select Download. Without folders, the workbook downloads immediately. The selection lists the plan folder first, then the ungrouped charts, then your folders, and includes only lists that hold charts. The workbook has one worksheet per selected list, in that order. Separate copies stored in different folders appear on their respective sheets. The workbook includes a Contents sheet linking to the exported tables, worksheets for selected folders, study and base information, and numeric data for each chart or crosstab. Weighting details accompany weighted outputs. Significance letters occupy a separate column beside the percentages so percentage cells remain numeric.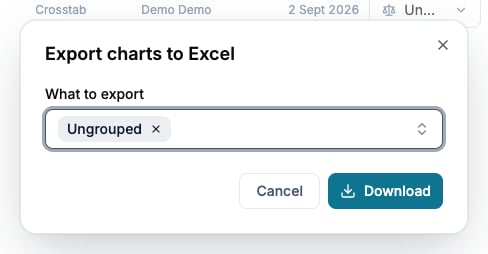
Select the folders and ungrouped charts to include in the workbook.