
Before you start
A completed report is required. Define the measure, subgroup, and evidence you need before writing the request.Meet the report requirement
Report chat becomes available after a report reaches Completed. If the view shows Chat Unavailable, generate the report or reload Analysis after generation completes.Start with a focused question
Open Data Analyst from the analysis view switcher when you want the conversation to use the full workspace.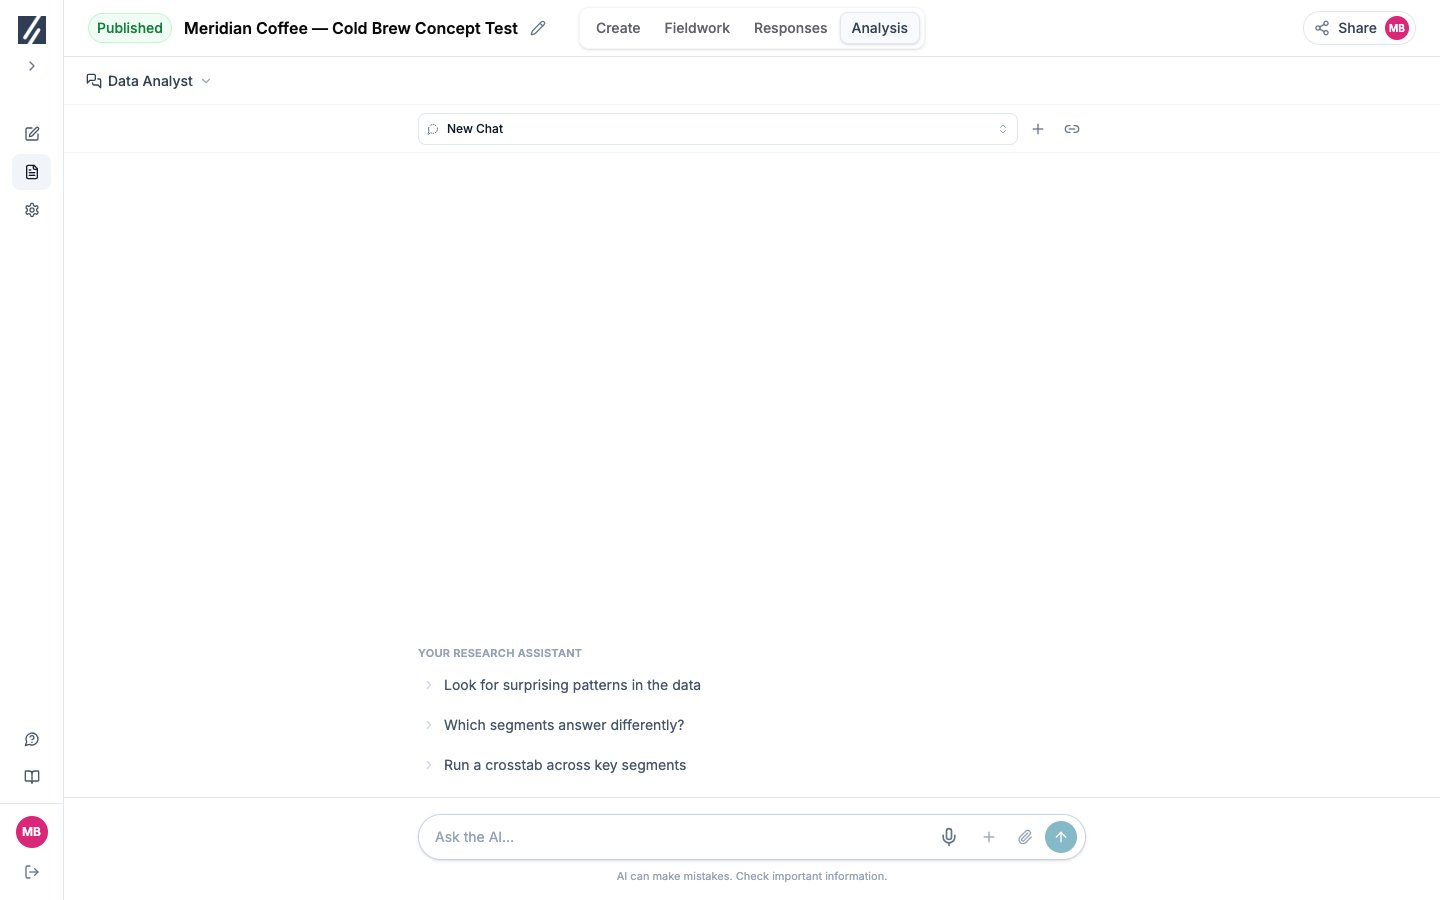
Data Analyst provides starter requests and a full-width conversation for the current report.
Ask one primary question per message. Use follow-up messages to refine the population, evidence, or output.
Verify an answer
Select a citation to open its source response. Select Show reasoning when you need to inspect how the assistant scoped or approached the request. Compare any generated figure with its source chart or table before using it outside the study.Attach reference material
Select Attach a file in the composer. A chat accepts PDF, DOCX, TXT, CSV, and XLSX, up to five documents across the chat and 32 MB per file. Use attachments to compare findings with a brief, codeframe, prior wave, or external table. State which document and field the assistant should use. Attachments remain available to later messages in the same chat. Deleting the message that introduced a document also removes that document from the chat context.Add a saved chart as context
Type @ in the composer and select a saved chart, or select Ask AI about this folder from a chart folder. The selected chart or folder appears as context for the next request. In Charts, the chart open on screen travels with your next message. The side panel names it and states whether the assistant can edit it.Ask the assistant to change a chart
1
Open the chart
Open one of your saved charts in Charts and select Assistant. The panel reads “the assistant can edit it”. For a plan chart it reads “auto-generated: the assistant can’t edit it”; for an unsaved chart, “save it to let the assistant edit it”.
2
Describe the change
Ask for a specific change to the configuration, title, or weighting, for example “Show this chart as percentages, split by age.”
3
Review the saved result
The assistant saves the change to the chart and notes “Chart updated” with Open chart under its reply. It does not save a configuration that returns no data. Check the question, breakdown, filters, weighting, and base of the updated chart before relying on it.
Add an assistant chart to a folder
A chart the assistant draws in the conversation carries the same save action as any other chart. Selecting it opens your folder list: pick a folder, or create one, then name the chart and confirm. On a chart already saved, the list shows the folder it is in, and picking another moves it. Review the chart’s base and filters before filing it in a folder you will present or turn into slides.Manage an active response
You can prepare and queue a follow-up while the assistant responds. Review queued messages before they are sent. Select Stop to stop the current response when the request needs correcting. Clear chat permanently removes the current conversation history. Start a new chat instead when the existing thread should remain available.Organize several analysis threads
Use New for a separate line of analysis. Rename each chat to match its purpose and pin current deliverable work. Search finds earlier chats by their content. The assistant uses the most recent 100 messages in a chat. Start another thread for a long or unrelated analysis rather than relying on older context.Check the result
The answer uses the requested population and identifies the relevant bases. Open its citations and compare figures with saved tables before using the wording in a deliverable. After a chart change, reopen the chart and confirm the saved version is the one you intend.Configure your plan before analysis
Use the separate Plan assistant in Analysis plan to prepare questions, comparisons, and variables before responses arrive. Its conversation is shared within the study and remains available after generation. See Build an analysis plan.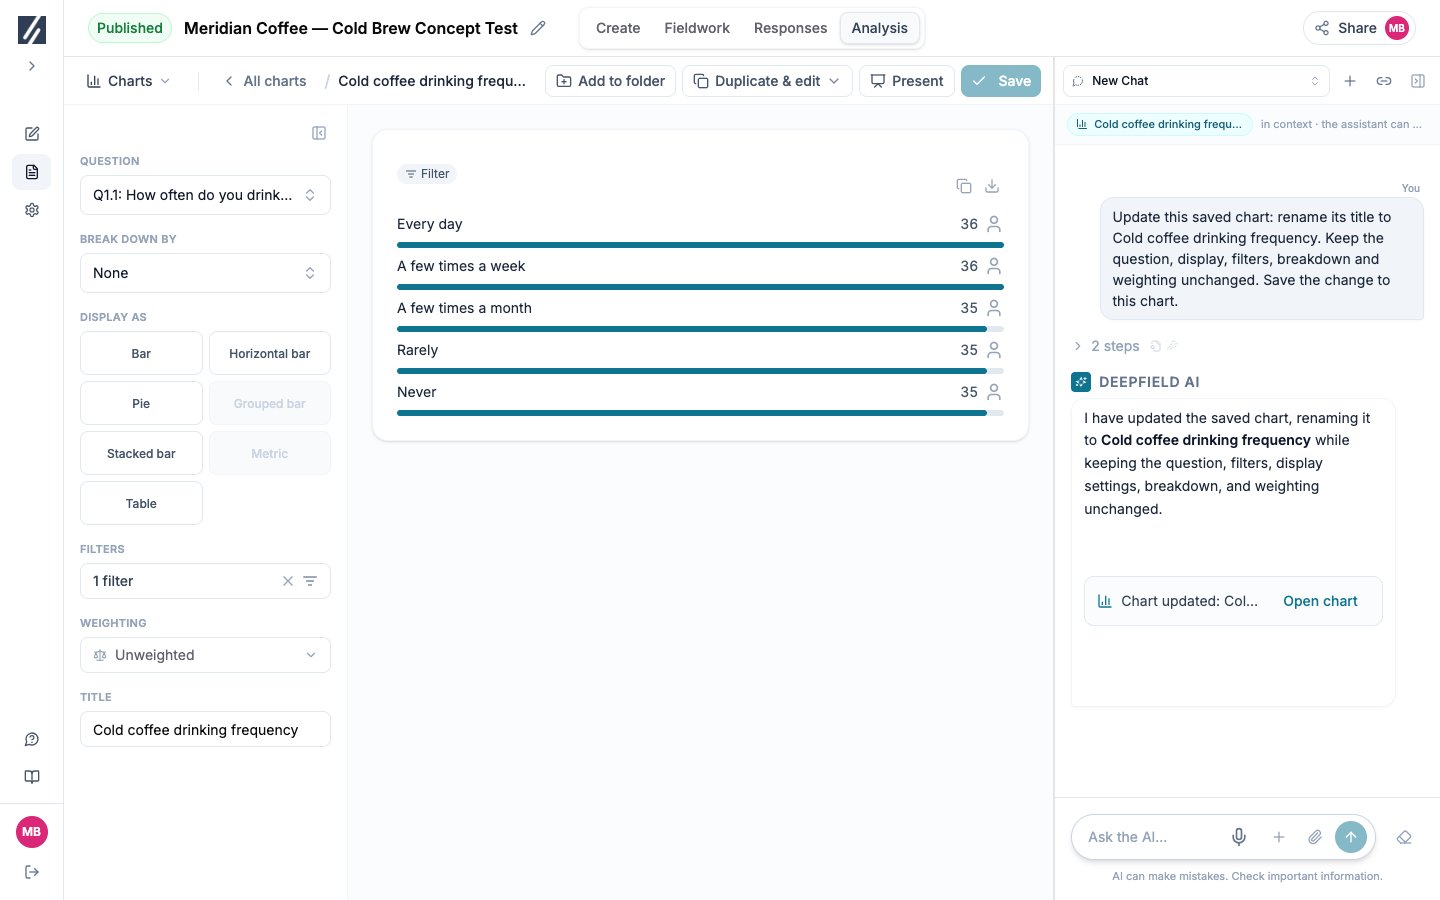
After a saved-chart change, use Open chart to verify the title and configuration.