
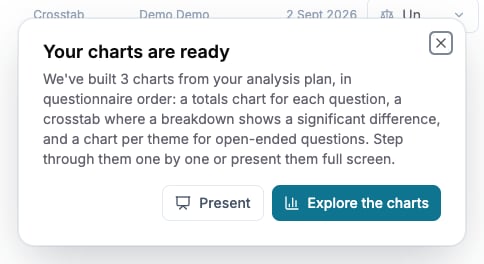
The completion dialog opens the generated charts or starts presentation mode.
Before you start
Confirm your response-quality decisions and choose the population, output language, and weighting you intend to report. An Editor or Owner can generate results. A Draft study can hold a saved plan but cannot generate analysis yet.Check whether generation is available
When a panel target is configured, eligible completed responses must reach at least 80% of the combined target. The page shows the completed and required counts. The calculation uses quality-passing completed responses, not every row in Responses. Output filters do not lower this threshold. If the study has no positive target, the percentage gate does not apply. Missing or invalid plan selections, an unresolved weighting scheme, variable saves in progress, or a generation already running can still prevent a launch. Read the displayed reason rather than changing the target merely to enable the action.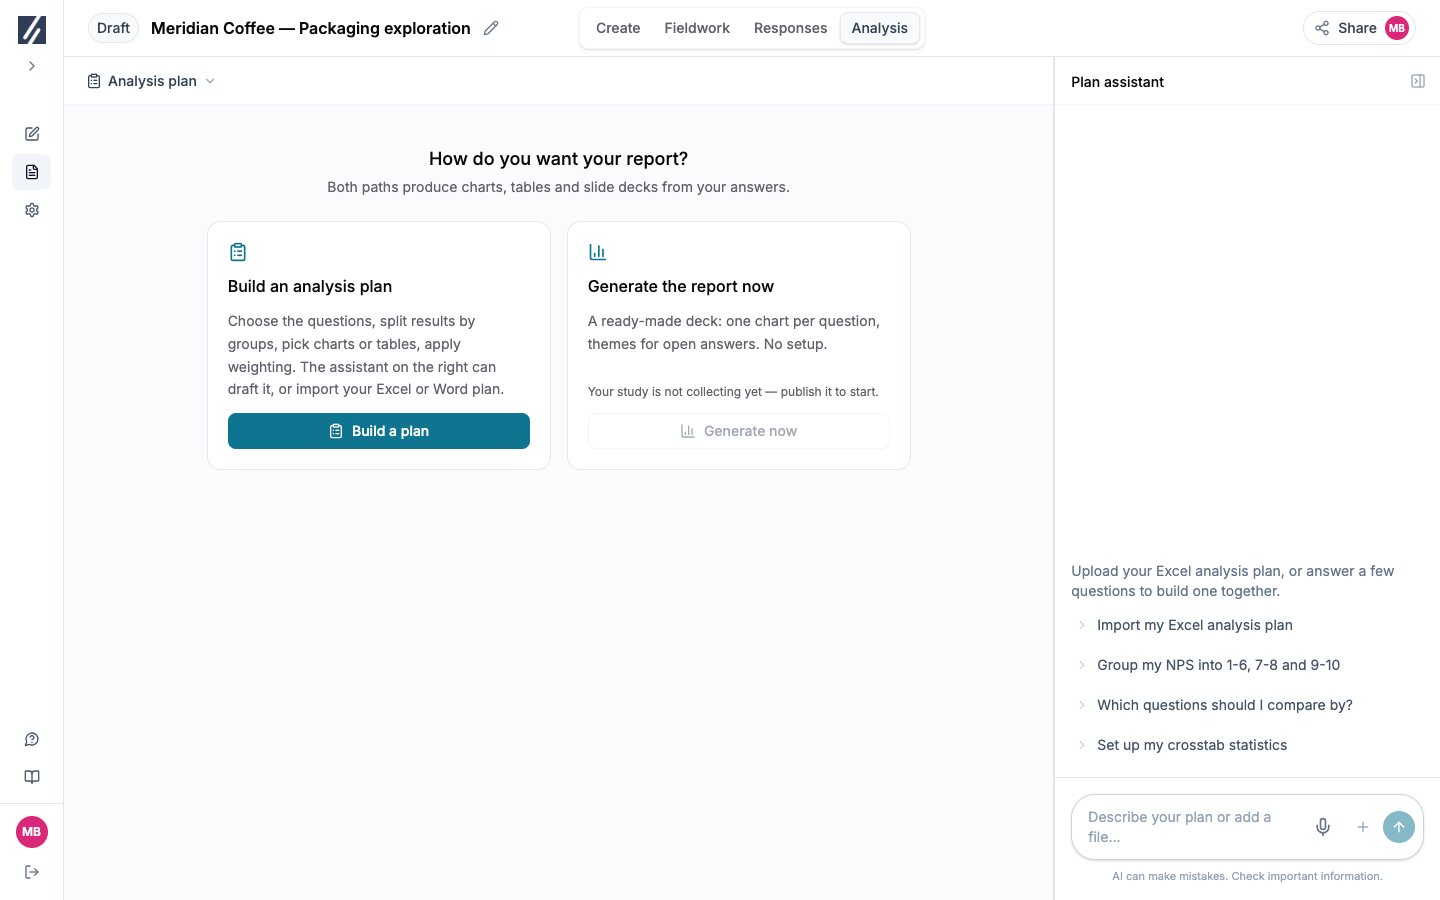
On the first visit, choose a general generation or prepare an analysis plan.
Generate the results
There are two routes. A saved plan builds a locked chart folder that you explore question by question before building a deck. Generate now builds a general slide deck without a plan.1
Choose the generation route
On the first visit, select Build a plan to choose the questions and comparisons yourself, or Generate now for a general deck. A general run uses the study language and unweighted answers, saves no plan, creates no plan folder, and opens Slides. The plan editor offers the same route as Generate without a plan; it ignores the visible plan’s filters and weighting.
2
Review the plan
Check the output language, weighting, response filters, questions, and per-question comparisons. Follow Build an analysis plan for the settings.
3
Save and generate
Select Save and generate. The current plan is saved before generation starts, and Charts opens. While the run is in progress, the library shows Building the charts from your analysis plan… or a refreshing marker on the existing plan folder. Generation continues on the server if you reload or leave the page.
4
Open your charts
If Analysis is open when the run completes, Your charts are ready states how many charts the plan folder holds. Select Explore the charts to open the first one, or Present to walk through them full screen. You can also open the plan folder from the top of the Charts library at any time.
What a plan run builds
The plan folder is named after the plan and follows the questionnaire, screening section first. For each planned question it holds:- The totals chart, when Charts is selected. An open-ended question gets one chart per theme instead; themes are built only for the open-ended questions in the plan.
- A crosstab by the question’s comparisons, when Tables is selected and the question is a multiple-choice question or categorical matrix outside the screening section.
Read the generation status
The analysis remains unavailable for conversation while its data is being prepared. Wait for generation to finish, then check that the plan folder holds the expected questions. A failed run shows Your plan is saved, but generation failed. You can try again. on the plan; no completion dialog appears. Generated content is a starting point for review. Check bases and individual claims before exporting or sharing.Update after more responses arrive
Return to the plan, review its settings, and select Save and regenerate. With the same output language, the run reuses the existing analysis. Existing themes are kept and only new open answers are classified into them; a planned open-ended question without themes gets them now. The plan folder is then rewritten to match the current plan and answers:- A chart whose configuration is unchanged is kept in place.
- New outputs are added in questionnaire order, including a crosstab whose comparison now shows a significant difference.
- Charts the plan no longer produces are removed from the plan folder, including a crosstab whose comparisons no longer qualify.
- Copies you saved into your own folders are not changed.