

The protected plan folder appears first, above saved charts and user folders.
Before you start
Identify the measure, base filters, breakdown, and weighting needed. Completed eligible responses must exist for a populated preview. Once a report has completed, Analysis opens on Charts.Explore the plan folder
After a plan run, the library lists the plan folder first. Its name is preceded by the Auto-generated badge, and each chart carries a lock. Folders load closed: select a folder’s name to show its charts. Its charts follow the questionnaire: for each planned question, the totals chart or one chart per theme, then a crosstab of the comparisons that showed a significant difference. A question whose comparisons did not qualify has no crosstab. See Build an analysis plan for the rule.1
Open the first chart
Select a chart name in the plan folder, or Explore the charts in the completion dialog.
2
Step through the questions
Use the previous and next arrows beside the chart counter, or the
ArrowLeft and ArrowRight keys. A chart opened from the plan folder walks the plan folder in order.3
Check each chart
Read the base, filters, and weighting before the values. For crosstabs, read the raw column bases before the coloured cells and letters. See Interpret significance.
4
Save charts for your story
Edit a plan chart as you would any other, then select Duplicate & save and choose an existing story folder or create one. Repeat for each chart you want to retain. Your copies can be edited further; the plan folder remains as the plan built it.
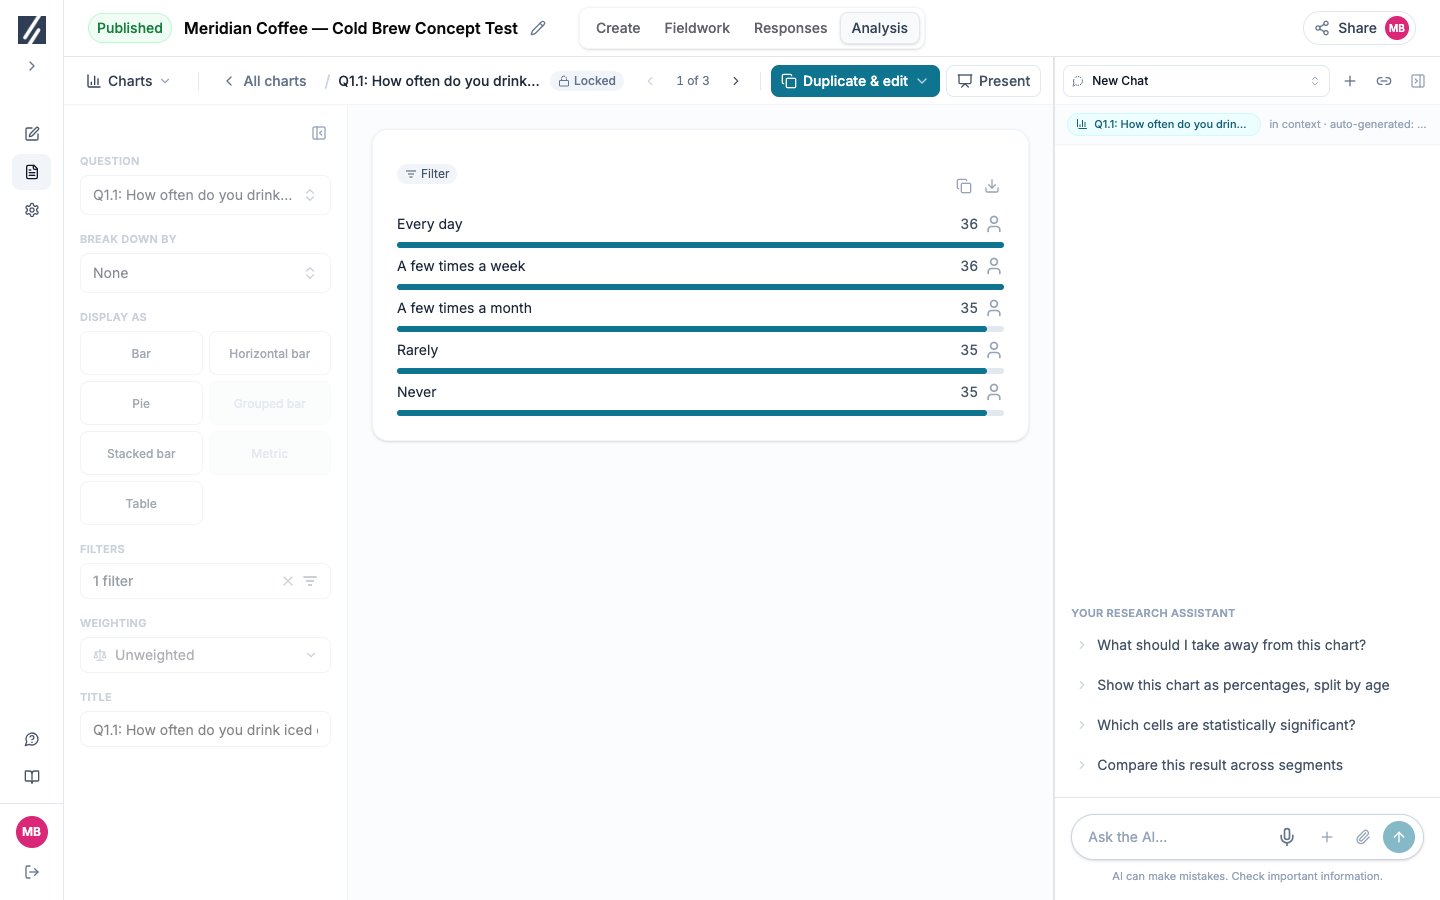
An auto-generated plan chart is edited like any other and saved as a copy.
Present charts full screen
Select Present in a chart’s toolbar to walk the same sequence full screen. The heading shows the question — and the theme on a theme chart — on the first line, and what the chart is broken down by on the second. Click the background, or press the right arrow, Space, Enter, or Page Down, to advance; press the left arrow or Page Up to go back. Selecting a control inside a chart — a breakdown tab, a bar — operates that chart and does not advance. Press Esc or the close control to return to the last chart shown.
Presentation mode walks through the folder’s charts full screen.
Edit a plan chart
1
Open the chart
Open any chart in the plan folder.
2
Change it
Edit the configuration or the weighting. The button in the toolbar changes from Add to folder to Duplicate & save, and Undo changes appears beside it.
3
Choose the destination folder
Select Duplicate & save and pick one of your folders, or select New folder…, enter a name, and select Create. The plan folder is never offered. The edited chart is filed there and opens in place of the original.
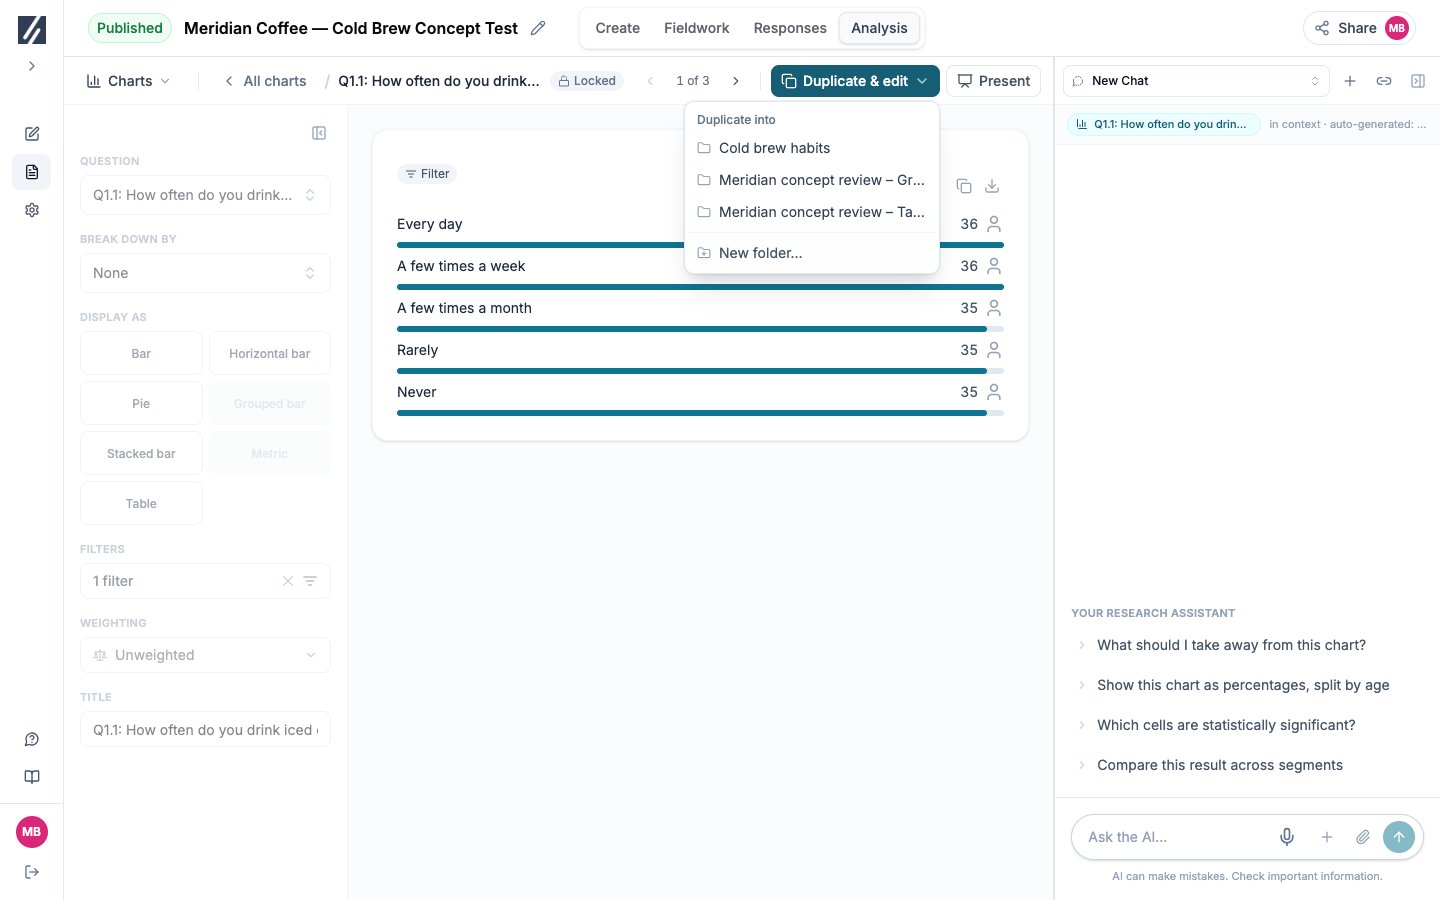
Choose the folder that will receive an editable chart copy.
Create a chart
1
Open Charts
In Analysis, choose Charts from the view switcher and select New chart.
2
Choose the question
Select the row variable under Question. The preview updates from completed, quality-passing responses.
3
Select Display as
Choose a supported graph type or Table. Disabled types do not fit the current question or breakdown.
4
Add a breakdown or filters
Use Break down by to split the chart by a second variable. Add filters when the chart should use a defined response subset.
5
Save
Select Save to charts. There is no name to enter: a chart is named by what it graphs — the question, the theme, and the breakdown — so rewording a question renames every chart that draws it.
Work with the library
Select a chart name to reopen its saved configuration. With nothing changed, the toolbar’s one action is Add to folder. Change a setting and it becomes Save, with Undo changes beside it; Undo changes puts the chart back to its saved configuration. Return a setting to its saved value by hand and the toolbar returns to Add to folder on its own. Leaving with pending changes displays Discard unsaved changes?. Select All charts to return to the library. Opened from one of your folders, a chart’s next and previous walk that folder. Opened from the ungrouped list, they walk the whole library. The save action on a chart — on a slide, in the report, or on a chart the assistant drew — files it into this same library. Selecting it opens the folder list; choose a folder, or create one from New folder…. Picking the folder is the whole decision: the chart is named by what it graphs, so there is nothing to type. On a chart already saved, the save action is filled and its dropdown shows the folder the chart is in. Choose another folder to move it, or Remove from saved charts to delete the library entry.Organize charts in folders
Select New folder, enter its name, and confirm. Folders support one level; they cannot contain other folders. Each saved chart belongs to one folder, or to the ungrouped list. Use Duplicate & edit in the row’s ⋮ menu when the same result needs a separate copy in another story folder. Open a chart row’s ⋮ menu:
In the chart view, Add to folder moves a user chart into the selected folder. On a plan chart it files a copy instead: the plan’s own chart stays in the plan folder.
Drag a row to reorder it within a list, or onto another folder to move it there. Plan charts cannot be dragged, and nothing can be dropped into the plan folder.
Select several user chart rows to apply weighting, move them, or delete them together. Check the selected count before confirming deletion.
Select Ask AI about this folder from a folder’s ⋮ menu to attach that folder’s saved charts to an assistant request.
Generate slides from a folder
Gather the verified charts for one story in a folder, then open the folder’s ⋮ menu and select Generate slides from this folder. The plan folder offers the same action. Slides opens with a new conversation named after the folder. Its first message is visible and asks the assistant to build a deck from that folder’s charts only, and to propose a storyline for your approval before composing slides. Review the Proposed storyline, then select Request changes or Approve & compose. See Build and review a slide deck. The action is unavailable, with the reason shown, before a report exists, while a generation is running, or when the folder is empty. Readers cannot generate slides.Apply weighting to one chart
When weighting schemes exist, choose Unweighted or a scheme from the chart row or builder. Each of your saved charts has its own selection; there is no study-wide default. Plan charts use the plan’s weighting. Changing the plan’s scheme and regenerating reapplies it to the plan folder. A copy keeps the weighting it had when duplicated until you change it.Generate charts in bulk
Select Bulk generate.1
Choose the output
Select crosstabs, frequency tables, Auto, or another available chart display.
2
Choose breakdowns
Crosstabs accept one or more Columns. Other chart outputs accept optional breakdowns and create one chart per selected breakdown.
3
Choose variables to analyze
Keep All questions or select a defined set. Ineligible question types are excluded from the resulting batch.
4
Set shared filters, weighting, and location
Add base filters, choose a saved weighting where available, and save to the root, a folder, or a new folder.
5
Review the count and generate
The confirmation reports how many charts will be produced and shows progress until the batch finishes.
Troubleshooting
The configuration panel is greyed out
The configuration panel is greyed out
You have view access to the study, so no chart can be edited. For an editor a plan chart is editable: its changes are kept with Duplicate & save.
A planned comparison has no crosstab
A planned comparison has no crosstab
No column in that comparison had an unweighted base of 30 or more with a significant cell. Build the crosstab with New chart to read the full table and its bases.
A saved variable no longer exists
A saved variable no longer exists
Reopen the chart, select a current question or variable in its place, and save. If the original specification is no longer meaningful, remove and rebuild the chart.