
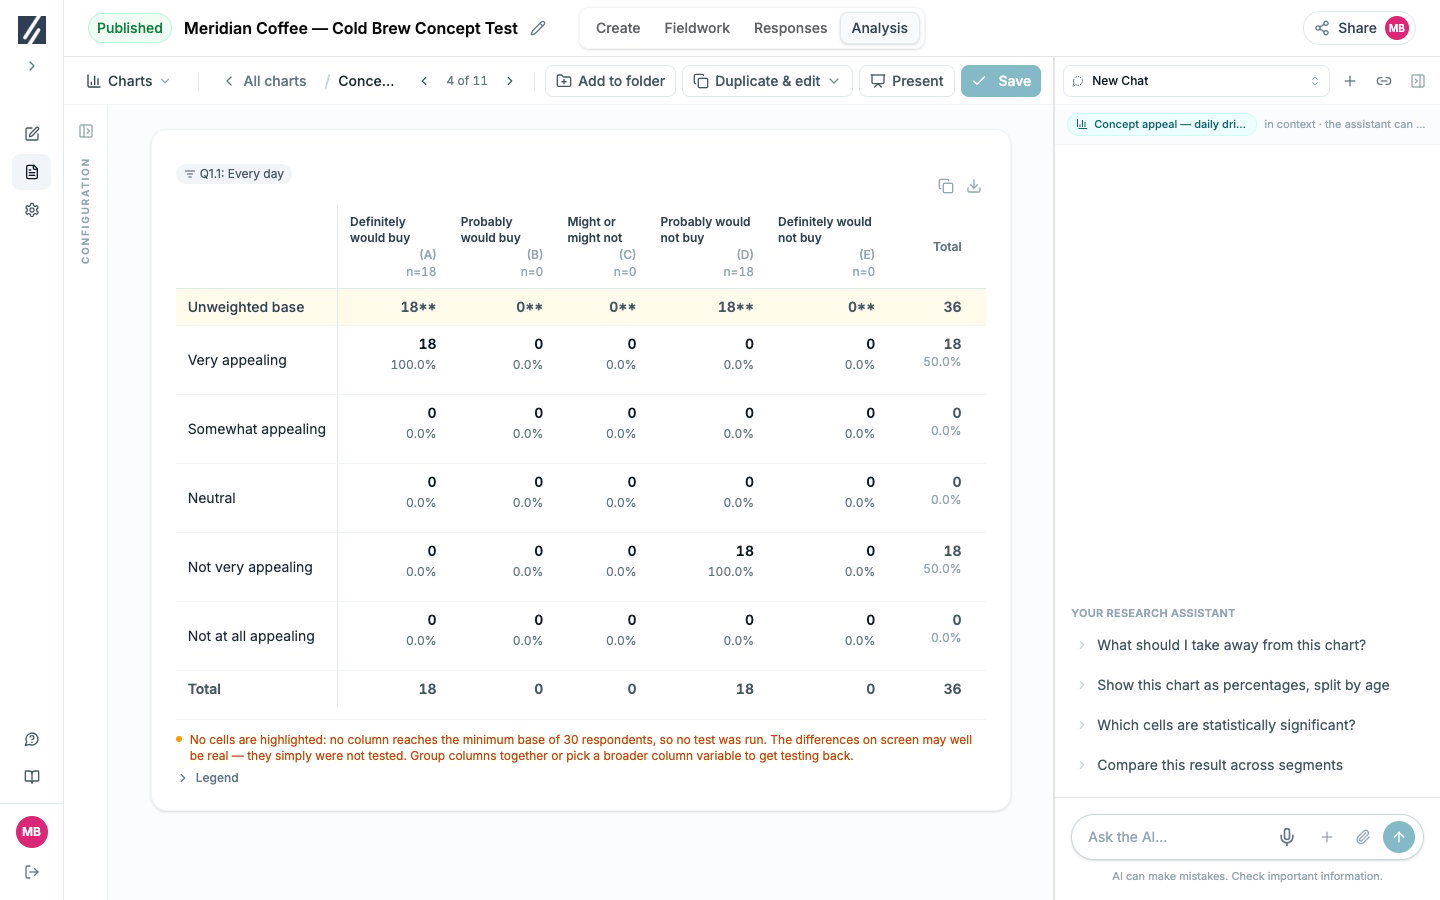
Neither populated column reaches 30: the differences are displayed but not tested.
Before you start
Open the table’s legend and identify its raw column bases, confidence levels, and tests.Distinguish colors from letters
- Significant cells colors compare each column percentage with the overall percentage on the same row. Green is higher and red is lower at the displayed level.
- Column proportions test letters compare columns directly. B in column A means A is significantly higher than B.
Interpret a 95% result
At a 95% confidence level, the result indicates that a difference at least this large would occur in fewer than 5% of repeated samples under the no-difference assumption used by the test. It does not mean:- The result is proven with 95% certainty.
- The difference is large enough to matter to the decision.
- One variable caused the other.
- An unmarked difference is evidence that the groups are identical.
Check the unweighted base
Crosstab tests use real respondent counts even when weighted values are displayed.
If all columns are below 30, no significance comparison is performed. A table without markers can therefore mean either that tests found no marked differences or that the bases were not eligible. Read the note beneath the table.
Account for repeated comparisons
A large crosstab can run many cell comparisons. At a 95% threshold, isolated markers can occur by chance across a large set of tests. Give more weight to comparisons specified in the analysis plan and to coherent patterns across related rows than to one unexpected marker found after scanning the table. The plan folder applies a selection of its own: each plan crosstab uses coloured significant cells and letters at a 95% primary level, and keeps only the comparisons in which a column with an unweighted base of 30 or more has a significant cell. A kept comparison can rest on a single marked cell, so read the whole table before reporting it. A planned comparison that was not kept is either untested because its bases were small or not significant; it is not evidence that the groups are identical.Write the result
Include:- The compared groups and measured answer.
- The percentage or mean in each group.
- The point difference where useful.
- The unweighted bases.
- The confidence level and test used.
- A directional qualifier when the result is not marked or not tested.