
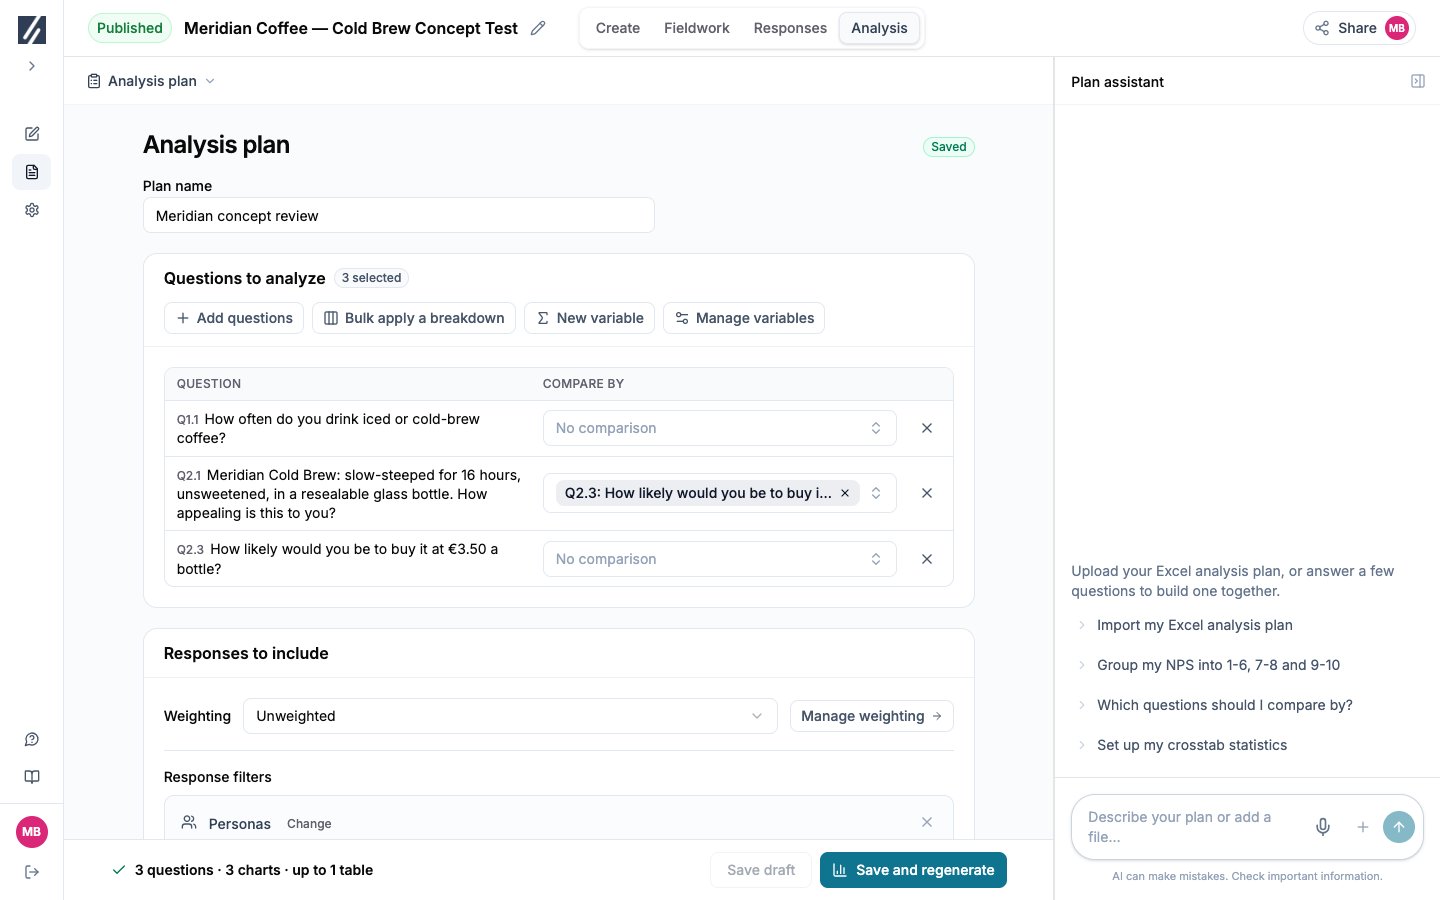
The saved plan selects three questions and a purchase-intent comparison.
Open the plan
Open Analysis → Analysis plan. On a study without a saved plan, select Build a plan. You can configure it yourself or ask the Plan assistant on the right to suggest a plan from your analysis brief or an Excel or Word plan. Review the suggested questions, comparisons, filters, and outputs before saving. The alternative Generate now builds a general slide deck from the answers without saving a plan or creating a plan folder, and opens Slides. See Generate and update analysis results. An Editor or Owner can change the plan and generate outputs. Readers can inspect it. You can save a plan in Draft; generation has separate response and study-state requirements.Select questions and comparisons
1
Name the plan
Enter a Plan name that identifies the analysis. The plan’s chart folder in Charts carries the same name.
2
Choose the questions
Select Add questions, then search or use Select all or All but screeners. Include only questions needed for the decision. Saved variables are available alongside questions.
3
Set each question's comparisons
Use Compare by on the question’s row. A question can have its own comparison groups; choosing a breakdown on one row does not apply it to every question.
4
Apply a comparison to several rows
Select Bulk apply a breakdown, choose the breakdown, and check the questions that should use it. Applying the selection also removes that breakdown from unchecked rows. Review the table afterward.
Define the response base
Under Responses to include, choose a saved Weighting scheme or Unweighted. Use Manage weighting to create or inspect schemes, then select the intended scheme in the plan. Every chart in the plan folder uses this scheme. See Create and apply weighting. Use Response filters to define the subset for the plan’s charts and tables. Confirm that the resulting bases support the planned comparisons. Filtering outputs does not change the study’s response-completion threshold.Choose outputs and table settings
Under Charts and tables, choose the output language and Charts, Tables, or both. The initial output language follows the study language. Selecting an open question enables Charts because its themes are chart outputs. What each choice produces for a planned question:
A crosstab keeps only the comparisons that show a difference. A comparison is kept when at least one of its columns has an unweighted base of 30 or more and a cell significant at the table’s primary confidence level; it is kept or dropped as a whole. When no comparison qualifies, the question has no table. A small study can therefore legitimately produce no crosstabs at all.
Open Advanced table settings to choose counts, column percentages, row percentages, statistical tests, and summary rows. Plan tables show coloured significant cells and use a 95% primary confidence level. Column comparisons use the raw test base even when displayed values are weighted. See Read statistical significance before interpreting markers.
Combine comparison groups into nested columns combines exactly two comparisons on a question into nested columns, kept or dropped as one. Use it only when the joint groups are relevant and their bases are sufficient.
The footer summarizes the plan as questions, charts, the maximum number of tables, and open-ended questions to theme. The preview lists each Chart, Table if significant, and Theme charts row in plan order; the final number of tables and theme charts is known only after the run. A plan with more than 50 charts and tables asks you to confirm with Generate anyway.
Work with the plan assistant
The Plan assistant is available before a report or responses exist. Describe the required analysis or attach an Excel or Word plan. Ask it to resolve unclear mappings, then inspect the questions, comparisons, filters, and settings it saves. The plan conversation is shared within the study and survives reloads and report generation. The assistant can propose a reusable variable. Review its cases or calculation, then select Add to the study or Edit. A proposal is not saved until you confirm it. Adding a variable makes it available to pickers; select it explicitly where the plan needs it. In Testing and live studies, New variable and Manage variables provide the manual editor when your access permits changes. Variables used by the live questionnaire’s routing, screening, piping, or quotas are locked. In Draft, edit variables in the study builder. See Create derived variables.Save and generate
Save draft stores the settings without generating results and accepts an incomplete plan. Unsaved edits are local to the open page; save before reloading. Assistant updates are combined with your pending edits, so review the visible settings before saving. Save and generate saves the visible plan, starts generation from that save, and opens Charts. When the plan folder already holds charts, the button reads Save and regenerate. The run builds the plan folder in Charts, named after the plan. For each planned question in questionnaire order, screening section first, the folder holds its totals chart or theme charts, then its crosstab when one qualifies. Planned variables follow the questions, in plan order. The plan folder is protected: its charts cannot be moved or deleted by hand, and it always holds what the last run produced. A chart in it is editable, but it cannot overwrite itself — open it, change it, then select Duplicate & save to file the edited chart in one of your folders. To keep one exactly as the plan built it, select Add to folder before changing anything: that files a copy. A regeneration rewrites the folder to match the current plan and answers, and removes charts the plan no longer produces; your copies are not affected. See Build and organize charts. If saving fails, your edits remain on the page and generation does not start. If generation fails after saving, the plan remains saved; resolve the displayed issue and retry. Missing questions, variables, or weighting must be repaired before generation.Check the result
Open the plan folder in Charts and step through it. Verify the selected questions, comparison groups, filters, language, weighting, and bases. When a planned comparison has no crosstab, check its column bases before concluding that the groups do not differ. Review themes against source answers before using the findings.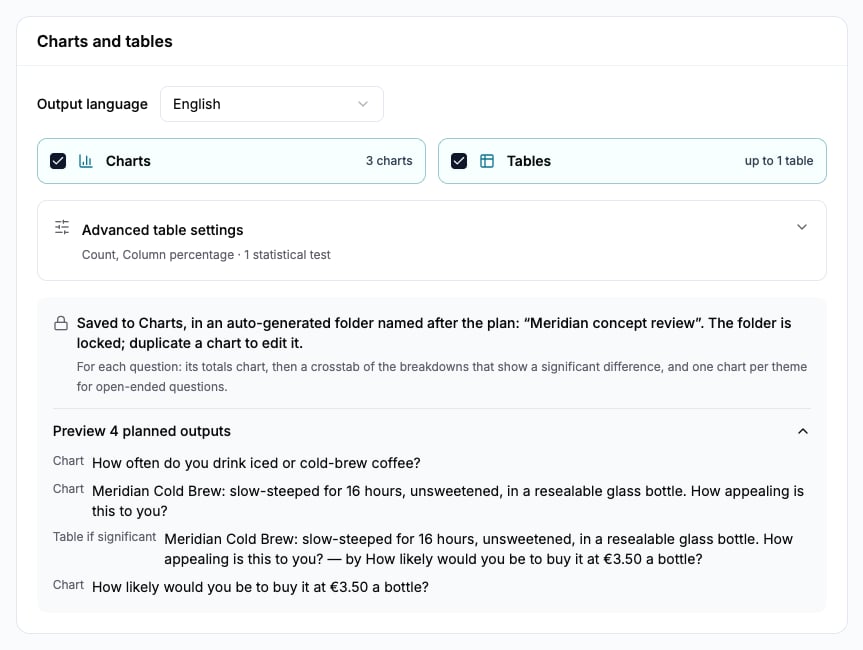
Preview distinguishes guaranteed charts from a table produced only if a comparison is significant.