
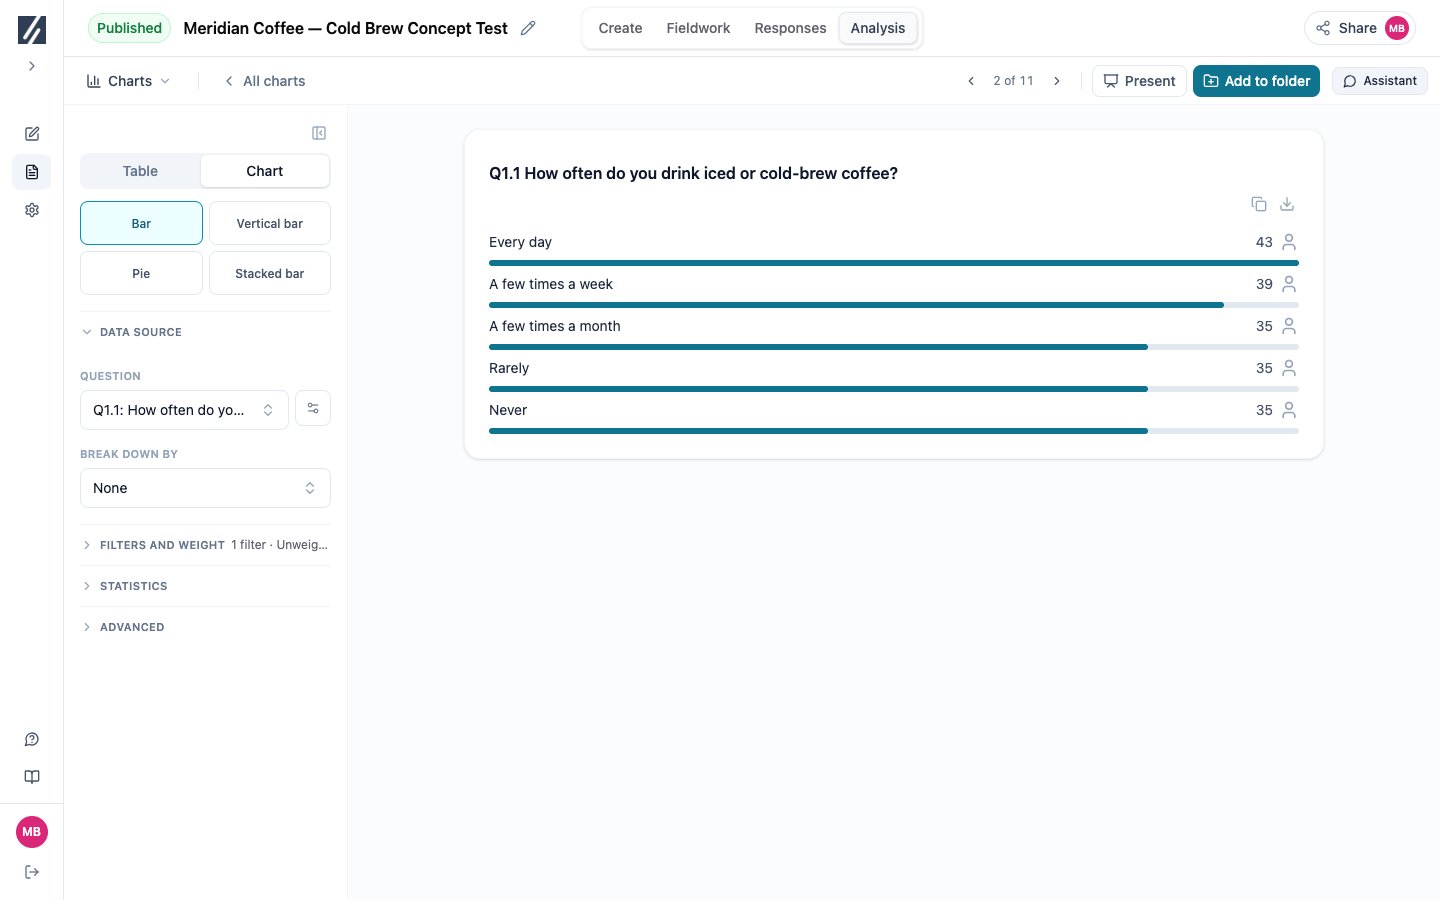
A copied chart exposes its question, breakdown, display, filters and weighting.
Before you start
Choose the question and any breakdown first. Decide whether readers need composition, comparison, or exact values.Compare the available types
Bar, vertical bar, and pie are available for many questions without a breakdown. Grouped and stacked bars require a compatible breakdown.
- Multiple-answer questions and open-text themes offer the same types as single-choice questions. A pie or stacked bar then shows shares of mentions, because one respondent can count in several parts; the chart says so.
- Numeric questions offer Vertical bar (the distribution, with optional statistics beneath the chart), Bar, Pie, Metric, and Box plot. With a breakdown, including the concept split of a concept loop, they offer Bar and Vertical bar (the average per group), Box plot (one box per group), and Metric (figures per group).
- Matrix questions offer Matrix and Star chart, with or without a breakdown. With a breakdown, each group has its own tab. Star chart needs at least three answer columns. A matrix of numeric cells offers Matrix only: each cell is the average of the numbers typed in it, and shows its share of the row, or its average with Show averages. For a categorical matrix, Metric switches from Answer distribution to one figure per row: Mean score per row, or the % on a net or an answer. See Compare attributes across brands.
- Allocation questions offer Bar, Vertical bar, Pie, and Stacked bar: the average points form the budget, so pie and stacked bar show each option’s share of it. With a breakdown: Bar, Stacked bar, Grouped bar, and Pie per group.
- Multi-numeric questions offer Bar (the average per item, with optional statistics beneath the chart), Vertical bar, and Box plot (one box per item). When the question shows respondents their total, Bar and Vertical bar show each item’s share of the total, and the tooltip gives its average; Show averages prints the averages instead. With a breakdown: Bar and Grouped bar.
- Ranking questions offer Ranking only: the average rank, where the longest bar is the best-ranked item. When respondents rank only their top N, an item a respondent did not rank counts as rank N + 1, so every average covers all respondents; the chart says so in a footnote marked *. MaxDiff questions offer Bar only: each item’s preference share or net score, see Read a MaxDiff. Table is not available for either type, because their answers are ranks and best–worst choices rather than answer categories.
Compare attributes across brands
An image or brand-association grid asked once per brand, inside a concept loop, normally shows one tab per brand. Choose Mean score per row, or the % on a net such as a top-2 box, under Metric: the chart then draws one line per attribute with one bar per brand side by side, so attributes can be compared across brands directly. Without a concept loop, the same view draws one bar per row, or one per group when a breakdown is set. When a looped grid also has another breakdown, each brand keeps its own chart. Mean scores come from the scale’s numeric values, or the numbers its labels start with; answers without a score, such as Don’t know, are left out. The scale used is printed under the chart, and each bar shows its base. Lead with MaxDiff adds, to the left of each attribute, its preference share from a MaxDiff question on the same items, and sorts the attributes by it. Rows are matched by the piped item or by the same wording. The same figures are available as a table: see Summarize a grid in one table.Read a MaxDiff
Choose the score under Metric in the chart builder.
Preference shares are relative to the tested items. Review filters, weighting and subgroup bases before comparing results. Small bases can produce unstable estimates. The browser and assistant estimate the model separately; do not expect their simulation results to match digit for digit.
Turn a table into a crosstab
Table with no breakdown is a frequency table. Add a question under Break down by and the same configuration becomes a crosstab with column bases and significance controls. Remove the final breakdown to return to a frequency table. Use a table for exact values and an appendix-style view. Use a crosstab when the analysis asks whether results differ between defined columns.Preserve a generated chart type
Charts created in a report can include types, such as Ranking, that are not offered in the standard Charts picker. A chart with a reusable specification can be saved to the library and edited. Changing one of these generated charts to a standard type can remove the option to return to its original generated display. Duplicate or save a separate copy first when the original must be retained. Some computed report visuals have no reusable chart specification and therefore cannot be saved. Build an equivalent chart manually when you need a controlled, editable version.Check readability
- Prefer Bar over Vertical bar when labels wrap or overlap.
- Limit pie charts to a small number of meaningful parts of one whole.
- Use grouped bars for a small number of comparison series.
- Use stacked bars when composition matters more than exact individual values.
- Add a table when the reader needs exact values or bases.
- Verify the base and filters regardless of display type.