
If Slides shows No Report Content Available, generate analysis first. You can prepare an analysis plan before responses arrive.
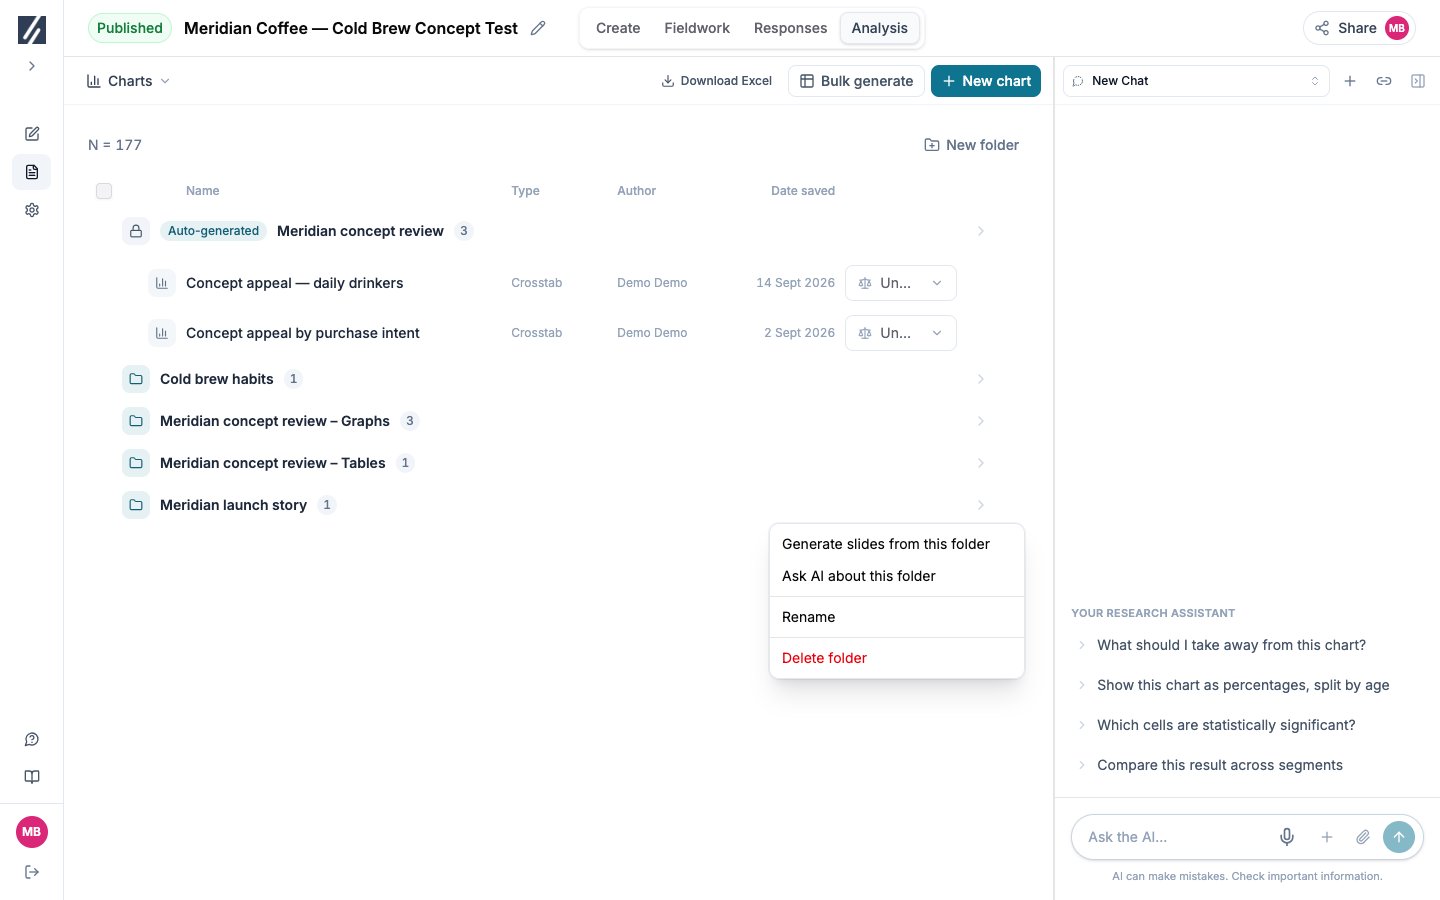
The folder menu starts a deck from the charts in that folder.
Before you start
Generate analysis and identify the audience and purpose of the presentation. In Charts, step through the plan folder and gather the charts that support your story in one of your folders. See Build and organize charts.Build a deck from a folder
1
Start from the folder
In Charts, open the folder’s ⋮ menu and select Generate slides from this folder. The plan folder offers the same action.
2
Read the request
Slides opens with a new conversation named after the folder. Its first message is visible: it asks for a deck built only from the folder’s charts, with a title slide, sections opened by short dividers, and one slide per key finding whose headline states the finding and whose text interprets the chart in one or two sentences. The request is written in the plan’s output language.
3
Review the proposed storyline
Before composing, the assistant replies with a Proposed storyline card: the question the deck answers, the answer it argues, and a numbered brief for each slide. Check that every brief rests on a chart in the folder and that the order supports the decision.
4
Request changes or approve
Select Request changes and describe what should change, or Approve & compose to have the slides built in storyline order.
5
Verify every slide
Compare each headline and interpretation with its chart, base, and weighting. Edit or ask for a targeted revision where the wording goes beyond the data.
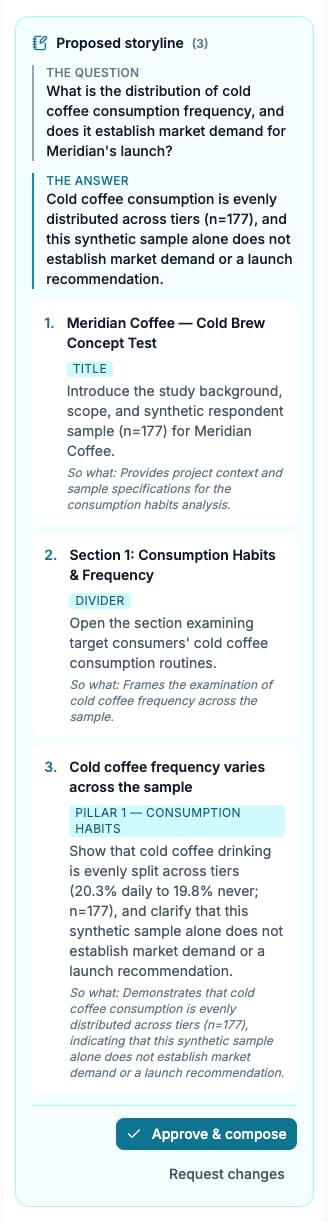
Check the storyline’s claims against the chart, then approve or request changes.
Open or create a deck
Open Analysis, then choose Slides from the view switcher. If the study already has a deck, its thumbnails appear on the left and the selected slide opens on the canvas. Use the chat selector to move between decks built in different conversations; a deck built from a folder carries the folder’s name. Generate now, on the first visit to the analysis plan, builds a general deck from the answers without a plan and opens it here. You can also ask the assistant in the chat panel to create a deck. Include the audience, purpose, desired length, and any findings that must be covered. For example:Create an eight-slide debrief for the product team. Lead with the purchase drivers, include the brand-preference chart, and finish with three recommendations.
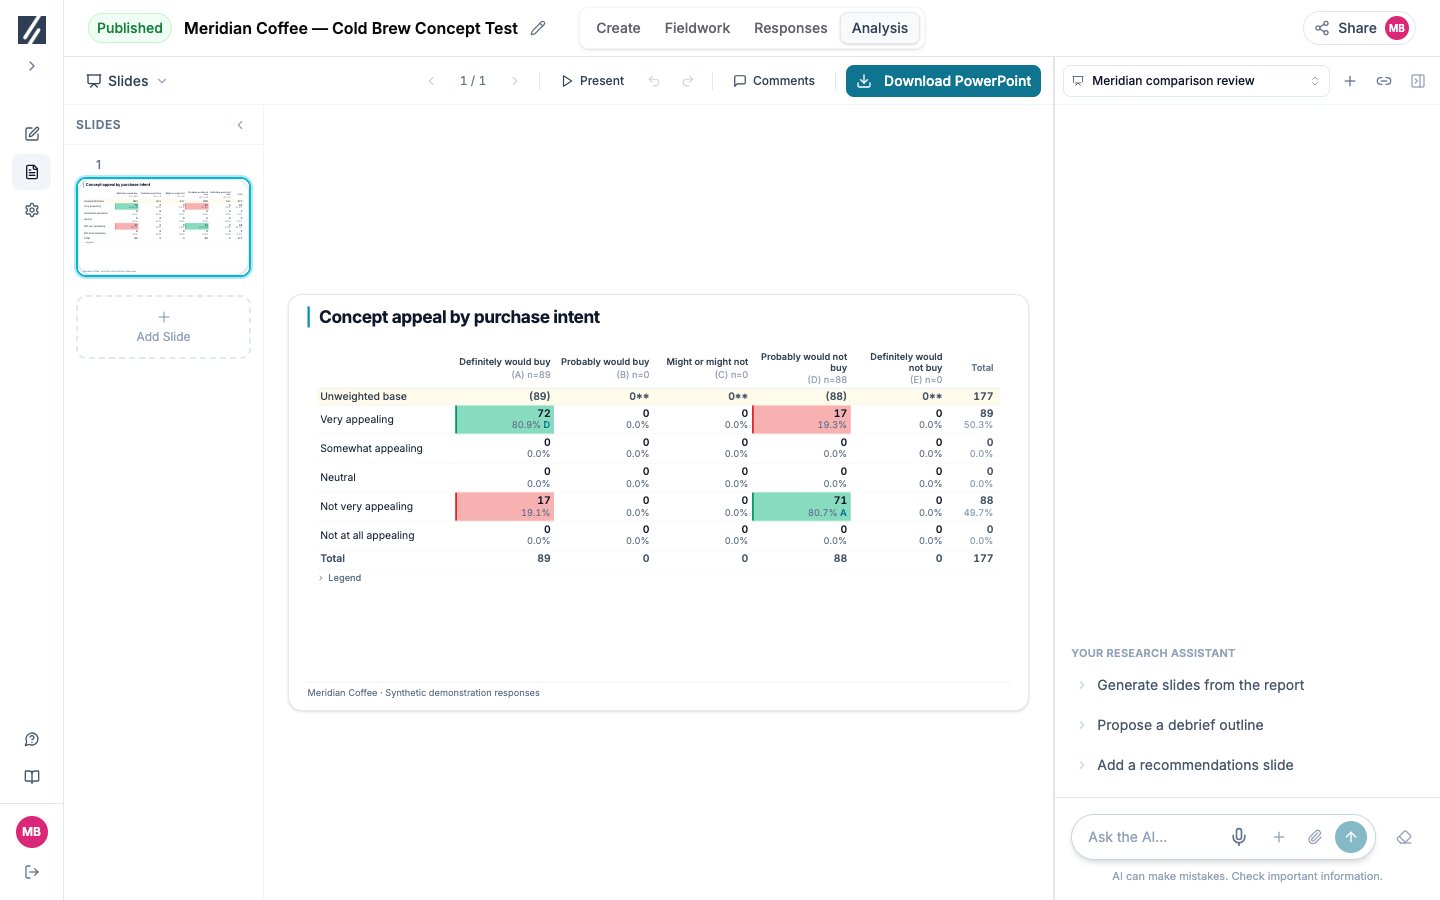
The Slides workspace combines the filmstrip, editable canvas, and the chat used to build the deck.
Add a slide or change its layout
Add a slide from the filmstrip, then choose a layout in Pick a layout. To restructure an existing slide, select the slide and choose Change template. Search the template gallery or browse its layout categories, then select the arrangement that fits the content. Changing the template replaces the slide’s current arrangement, so save the deck before experimenting with a heavily edited slide. You can also duplicate the slide from Slide options (⋯) and try the new layout on the copy.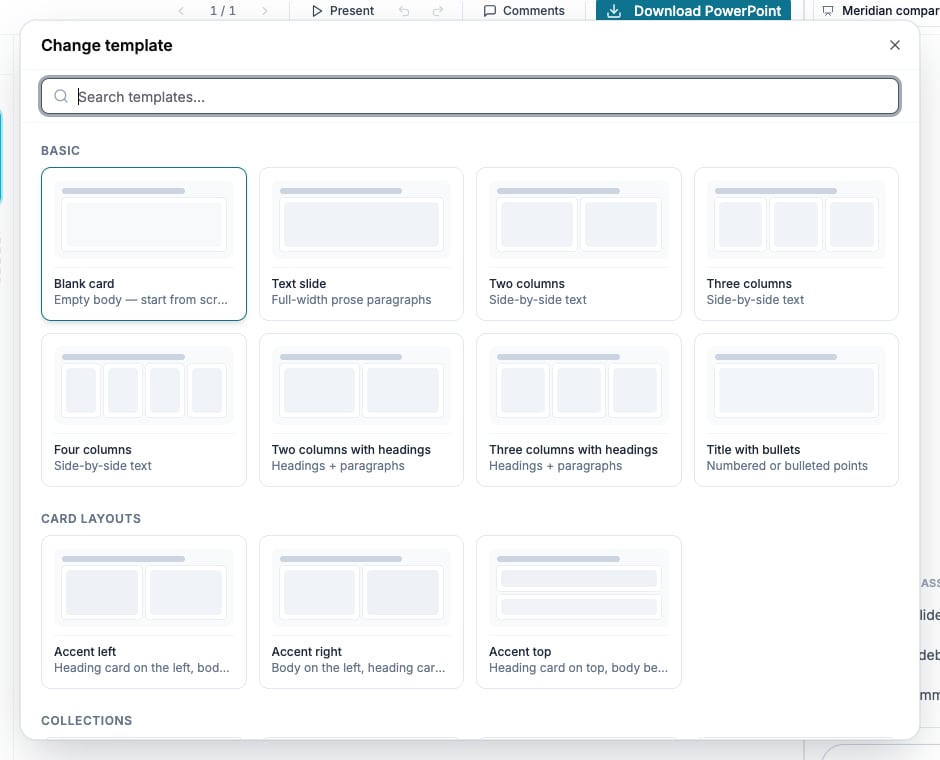
The layout gallery previews structures for headlines, metrics, quotes, charts, and mixed content.
Add and arrange content
Hover between blocks and select + to open the Insert menu. You can add:- Saved charts from the study’s chart library
- Text, Insight callout, and Quote blocks
- Metric and Stat list blocks
- A new Chart or Table block
- A Card, which groups content in its own bordered layout
Add a chart
For a chart you have already reviewed, select + → Saved charts and choose Insert beside the chart. The drawer lists the plan folder first, then ungrouped charts, then your folders. Plan charts can be inserted but not renamed, removed, or edited from the drawer. Other saved charts can also be edited or attached to the chat with Add to chat. For a simple chart created directly on the slide, insert a Chart block and configure its title, chart type, question IDs, optional themes, breakdown, and percentage display. Build more involved charts in the Charts view first, then insert the saved result.Crosstabs and other table-style analyses should be built in Charts and inserted as saved items. Export their full numeric output to Excel when needed. Verify the base and weighting of each slide against the intended source chart.
Ask the assistant to revise one part
Select a slide, row, column, or content block and choose Ask AI. The chat composer shows the selected element under Asking about. Write a specific instruction such as “reduce this to three bullets” or “replace this chart with the purchase-frequency chart.” Selection keeps the request scoped to that element. Use the jump control on its chat chip to return to the corresponding place on the canvas.Save the deck
After an edit, the toolbar shows Save Changes and Undo changes. Save Changes commits the current deck. Undo changes restores the last saved version and discards every unsaved edit in the current session. Save before commenting or exporting. If the assistant creates a newer deck while you have local edits, choose whether to Keep my edits or Load latest; loading the newer version replaces the unsaved work.Add and resolve comments
Save the deck, select a slide or block’s comment button, and send the review request. Follow Review slides with comments to check the anchor, process threads, and resolve verified changes.Export to PowerPoint
Select Download PowerPoint to download the saved deck as an editable PowerPoint file. The PowerPoint file is rebuilt as editable presentation content, so dense text can wrap differently from the browser preview. Open the file and check line breaks, chart placement, and speaker-facing details before presenting it. Crosstabs export as editable tables. For the complete numeric workbook, export Charts to Excel.If an action is unavailable
Check the result
Save the deck and verify each claim against its source chart and raw base in the folder it was built from. Open the PowerPoint file and check every slide, including table continuations, for wrapping and placement.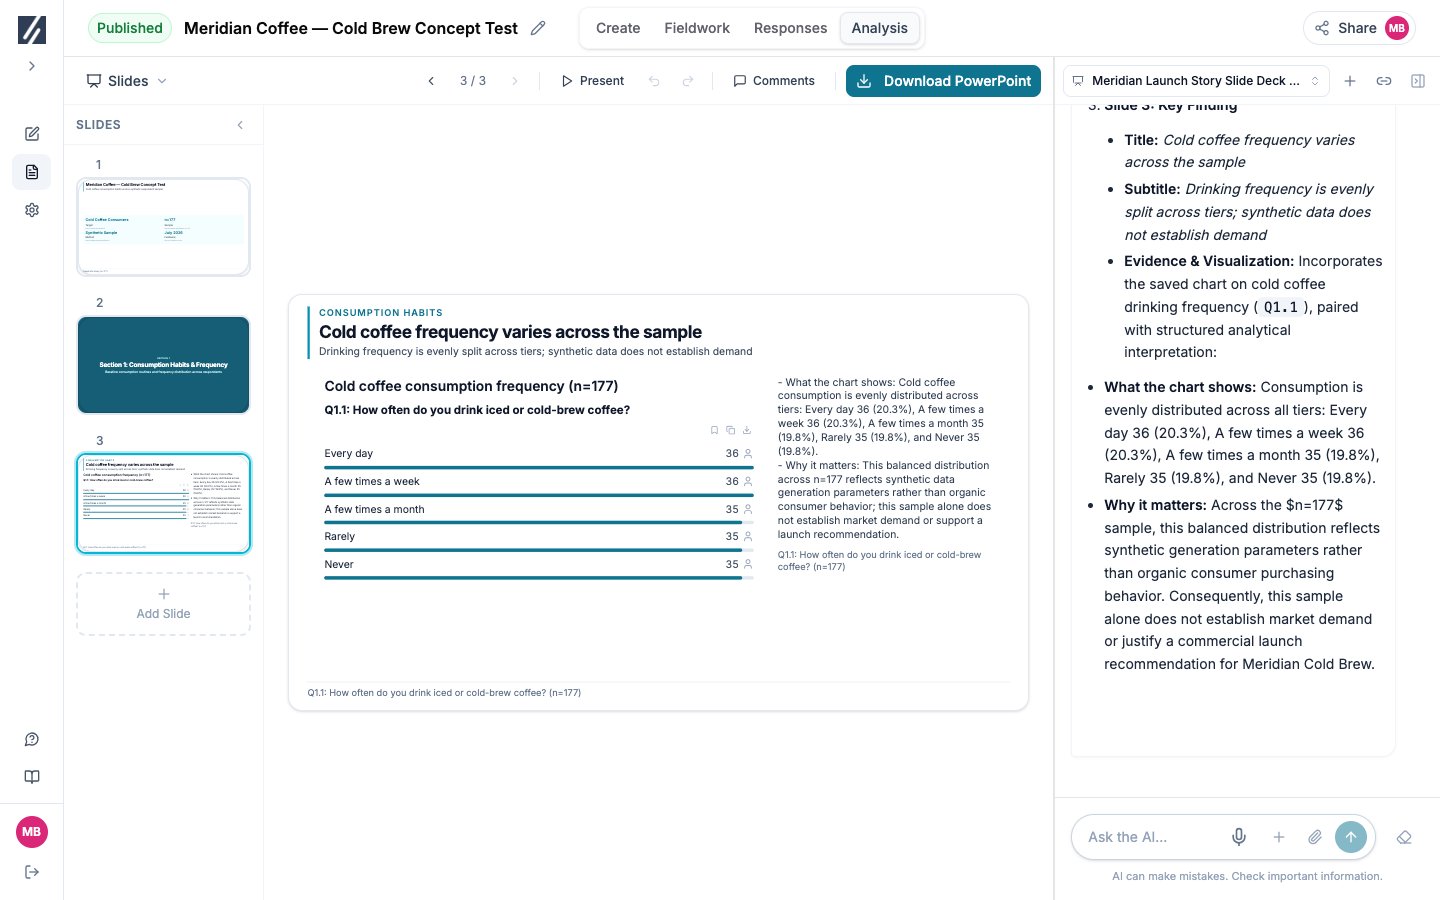
The composed finding slide keeps its source chart, base and interpretation together.