> ## Documentation Index
> Fetch the complete documentation index at: https://support.deepfield-ai.com/llms.txt
> Use this file to discover all available pages before exploring further.
# Export your results
> Download editable slides, chart workbooks, individual tables, response data, or the questionnaire.
Choose the export that matches your deliverable, then check its saved content, response base, filters, and weighting before sharing it.
| Deliverable | Where to export it | File type |
| --------------------------- | ------------------------------------------- | -------------------------- |
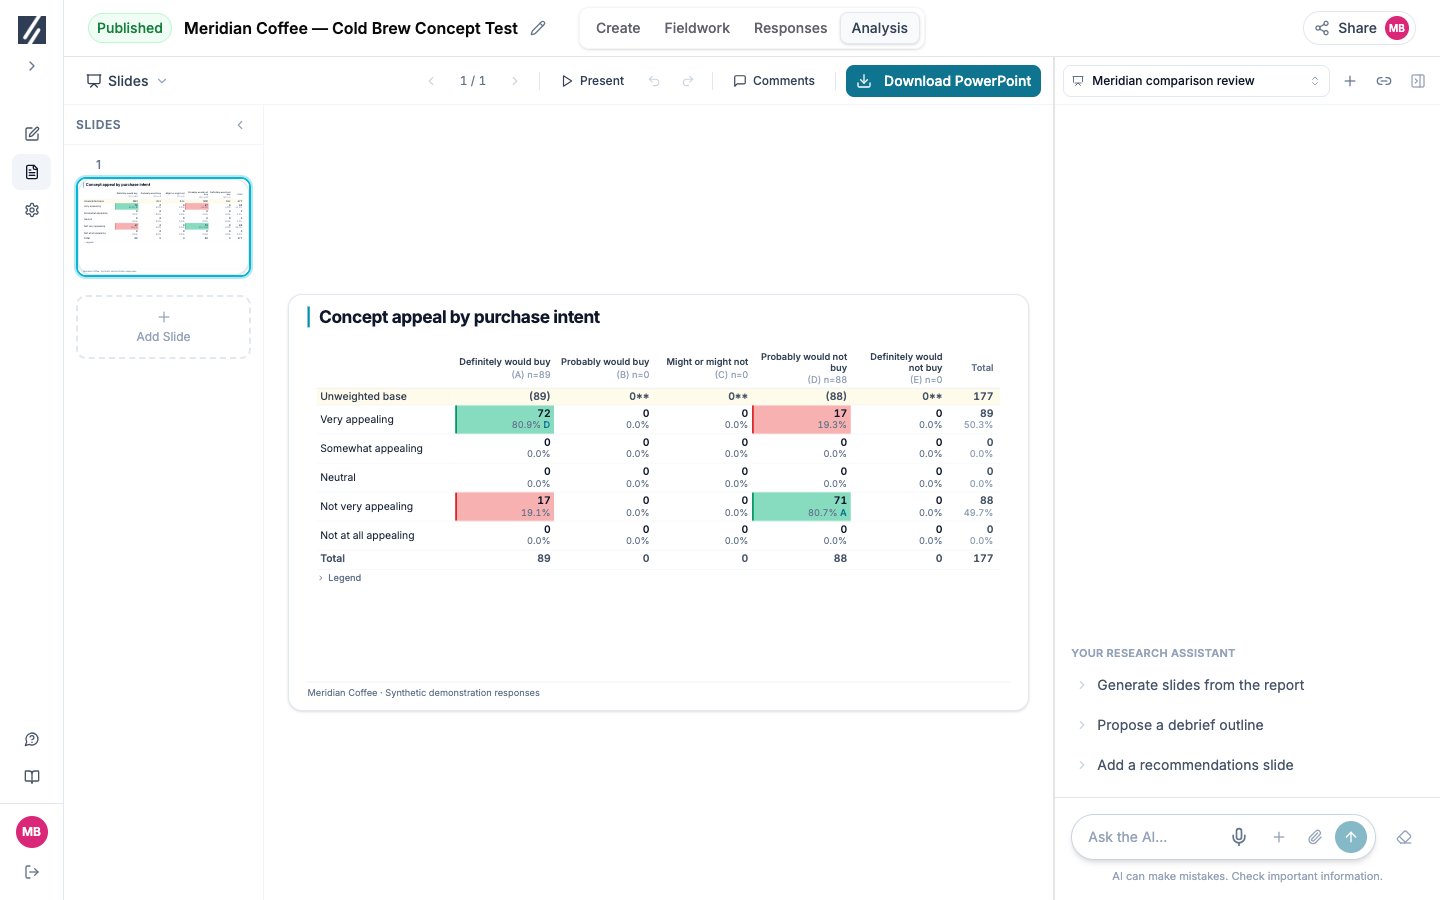
| Open slide deck | **Analysis → Slides → Download PowerPoint** | PowerPoint (.pptx) |
| Saved charts and crosstabs | **Analysis → Charts → Download Excel** | Excel (.xlsx) |
| One chart's values | Chart action menu | Clipboard or Excel (.xlsx) |
| Participant-level responses | **Responses → Download Excel** | Excel (.xlsx) |
| Questionnaire and logic | **Create → More actions → Download Word** | Word (.docx) |
## Before you start
Save pending edits. Confirm the intended deck or chart folders are open and the analysis includes the responses you need. [Generate from the analysis plan](/analysis/generating-reports) if its outputs need updating.
## Export a deck to PowerPoint
Open **Analysis → Slides**, select the required deck, and save any current edits. Select **Download PowerPoint** to download that deck. Build the deck from a folder of verified charts ([Build a deck from a folder](/analysis/slides#build-a-deck-from-a-folder)), or create and revise it through the analysis assistant before exporting.
The file contains editable presentation elements, including chart and crosstab tables. Wide or tall tables can span several slides. Generated slides use a 16:9 layout with the table title and base information; inspect every continuation slide so the column labels and data remain readable.
The file is rebuilt from the saved content, so line wrapping can differ from the browser. Open it in PowerPoint and check dense text, table boundaries, chart placement, and the bases used by each result.
 ## Export the chart library to Excel
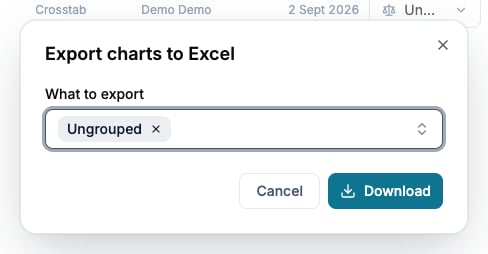
Open **Analysis → Charts → Download Excel**. When the library has folders, choose which folders and ungrouped charts to include, then select **Download**. Without folders, the workbook downloads immediately.
The selection lists the plan folder first, then the ungrouped charts, then your folders, and includes only lists that hold charts. The workbook has one worksheet per selected list, in that order. Separate copies stored in different folders appear on their respective sheets.
The workbook includes a **Contents** sheet linking to the exported tables, worksheets for selected folders, study and base information, and numeric data for each chart or crosstab. Weighting details accompany weighted outputs. Significance letters occupy a separate column beside the percentages so percentage cells remain numeric.
## Export the chart library to Excel
Open **Analysis → Charts → Download Excel**. When the library has folders, choose which folders and ungrouped charts to include, then select **Download**. Without folders, the workbook downloads immediately.
The selection lists the plan folder first, then the ungrouped charts, then your folders, and includes only lists that hold charts. The workbook has one worksheet per selected list, in that order. Separate copies stored in different folders appear on their respective sheets.
The workbook includes a **Contents** sheet linking to the exported tables, worksheets for selected folders, study and base information, and numeric data for each chart or crosstab. Weighting details accompany weighted outputs. Significance letters occupy a separate column beside the percentages so percentage cells remain numeric.
 ## Export one chart
Open its action menu and select **Copy data to clipboard** or **Download as Excel**. The output reflects the chart's filters, breakdowns, and weighting. Clipboard data is tab-separated for pasting into a spreadsheet. A crosstab export includes its grid and statistical results.
## Export response-level data
Open **Responses**, apply the required filters, and select **Download Excel**. Use this for one record per participant, source answers, screening outcomes, and quality fields. See [Export response data](/responses/exporting-data) for the workbook structure and custom-question raw values.
In chart details, **Download Excel** exports the participant answers for the displayed segment, including the chart’s filters. Compare the downloaded base with the detail panel; it is a response workbook, distinct from the chart-library workbook.
## Export the questionnaire
Open **Create → More actions → Download Word**. The document contains questionnaire wording, options, and logic for review or archiving. It does not contain participant responses or analysis. Check [stimulus export limitations](/building-your-study/stimulus-materials) when the questionnaire includes media.
## Choose the right delivery format
Use PowerPoint for an editable presentation, the chart workbook for complete numeric tables, and the response workbook for participant-level analysis. Share response data only with recipients who need that access. A downloaded presentation can be sent without granting access to the study.
## Troubleshooting
| Problem | Check |
| ------------------------------------- | ---------------------------------------------------------------------- |
| A chart is absent from the workbook | Save it in Charts and select its folder for export. |
| The deck differs from the latest work | Open the correct deck and save pending changes. |
| Text or tables wrap differently | Review the exported file and adjust the slide content or layout. |
| A base differs between files | Compare filters, weighting, question eligibility, and generation time. |
## Check the result
Open the downloaded file and compare one key figure, its denominator, and any comparison marker with the source chart. Check all slides and worksheets before delivery.
## Related
* [Build and review a slide deck](/analysis/slides)
* [Build and organize charts](/analysis/charts-library)
* [Export response data](/responses/exporting-data)
* [Verify analysis results](/analysis/report-sections)
## Export one chart
Open its action menu and select **Copy data to clipboard** or **Download as Excel**. The output reflects the chart's filters, breakdowns, and weighting. Clipboard data is tab-separated for pasting into a spreadsheet. A crosstab export includes its grid and statistical results.
## Export response-level data
Open **Responses**, apply the required filters, and select **Download Excel**. Use this for one record per participant, source answers, screening outcomes, and quality fields. See [Export response data](/responses/exporting-data) for the workbook structure and custom-question raw values.
In chart details, **Download Excel** exports the participant answers for the displayed segment, including the chart’s filters. Compare the downloaded base with the detail panel; it is a response workbook, distinct from the chart-library workbook.
## Export the questionnaire
Open **Create → More actions → Download Word**. The document contains questionnaire wording, options, and logic for review or archiving. It does not contain participant responses or analysis. Check [stimulus export limitations](/building-your-study/stimulus-materials) when the questionnaire includes media.
## Choose the right delivery format
Use PowerPoint for an editable presentation, the chart workbook for complete numeric tables, and the response workbook for participant-level analysis. Share response data only with recipients who need that access. A downloaded presentation can be sent without granting access to the study.
## Troubleshooting
| Problem | Check |
| ------------------------------------- | ---------------------------------------------------------------------- |
| A chart is absent from the workbook | Save it in Charts and select its folder for export. |
| The deck differs from the latest work | Open the correct deck and save pending changes. |
| Text or tables wrap differently | Review the exported file and adjust the slide content or layout. |
| A base differs between files | Compare filters, weighting, question eligibility, and generation time. |
## Check the result
Open the downloaded file and compare one key figure, its denominator, and any comparison marker with the source chart. Check all slides and worksheets before delivery.
## Related
* [Build and review a slide deck](/analysis/slides)
* [Build and organize charts](/analysis/charts-library)
* [Export response data](/responses/exporting-data)
* [Verify analysis results](/analysis/report-sections)