> ## Documentation Index
> Fetch the complete documentation index at: https://support.deepfield-ai.com/llms.txt
> Use this file to discover all available pages before exploring further.
# Choose a chart type
> Match the chart or table to the selected question, breakdown, and result you need to communicate.
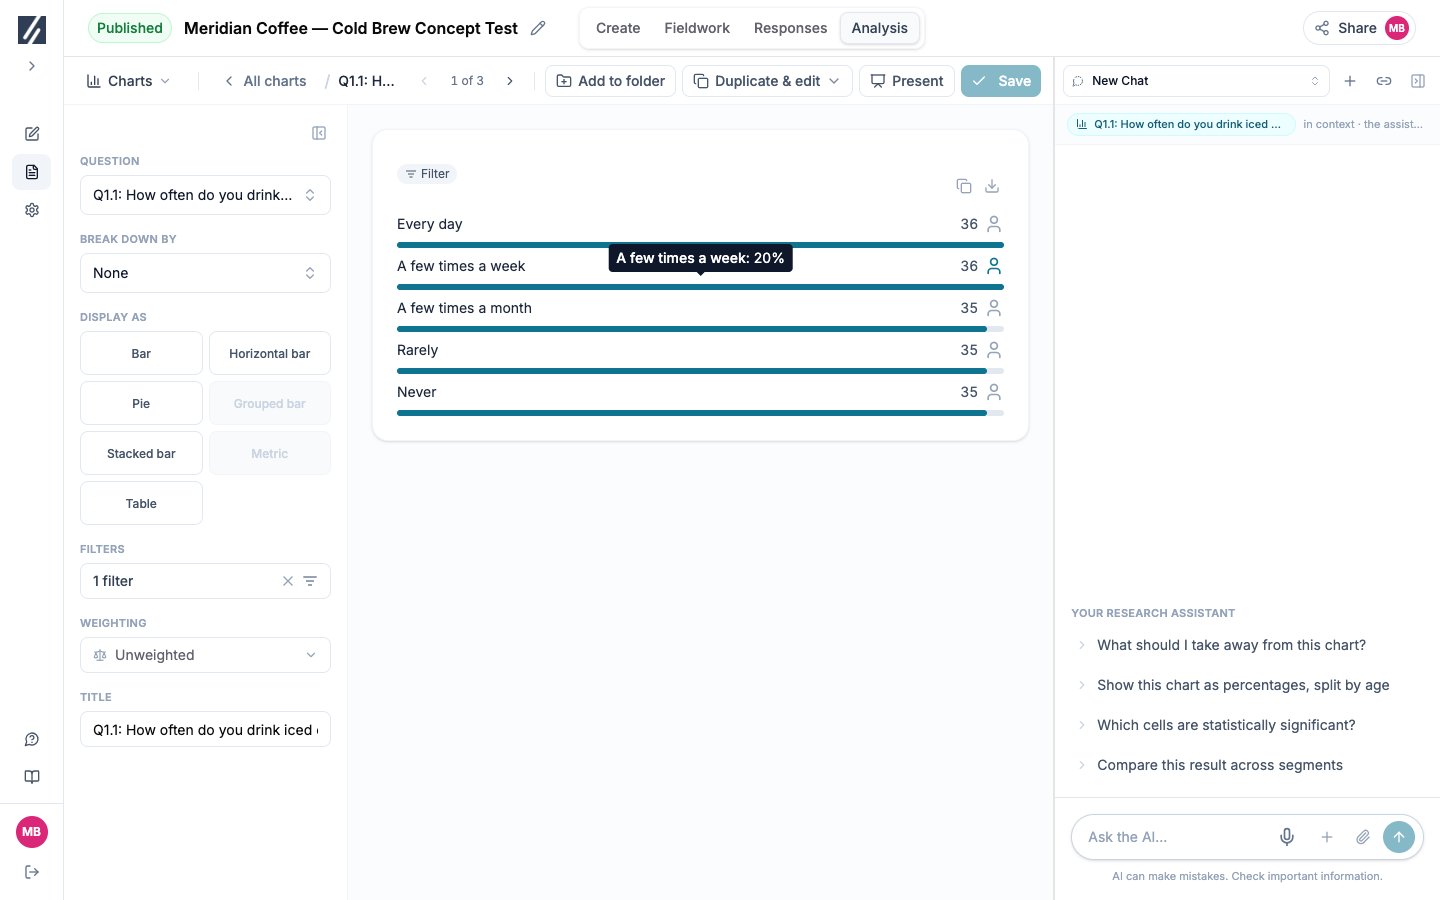
Chart availability depends on the selected question and whether a breakdown is present. A type that cannot represent the current configuration is disabled with **Not available for this question**.
 ## Before you start
Choose the question and any breakdown first. Decide whether readers need composition, comparison, or exact values.
## Compare the available types
| Type | Use it for |
| ------------------ | ---------------------------------------------------------------------- |
| **Bar** | Comparing answer values with short labels |
| **Horizontal bar** | Comparing values when labels need more horizontal space |
| **Pie** | Showing a small number of mutually exclusive parts of a total |
| **Grouped bar** | Comparing a small number of breakdown series side by side |
| **Stacked bar** | Comparing the composition of answer categories across items |
| **Metric** | Presenting one numeric result prominently |
| **Table** | Reading exact counts and percentages, with or without crosstab columns |
Bar, horizontal bar, and pie are available for many questions without a breakdown. Grouped and stacked bars require a compatible breakdown. Numeric and matrix questions can make additional types available.
## Turn a table into a crosstab
**Table** with no breakdown is a frequency table. Add a question under **Break down by** and the same configuration becomes a crosstab with column bases and significance controls. Remove the final breakdown to return to a frequency table.
Use a table for exact values and an appendix-style view. Use a crosstab when the analysis asks whether results differ between defined columns.
## Preserve a generated chart type
Charts created in a report can include types such as Matrix, Star Chart, Box Plot, or Ranking that are not offered in the standard Charts picker. A chart with a reusable specification can be saved to the library and edited.
Changing one of these generated charts to a standard type can remove the option to return to its original generated display. Duplicate or save a separate copy first when the original must be retained.
Some computed report visuals have no reusable chart specification and therefore cannot be saved. Build an equivalent chart manually when you need a controlled, editable version.
## Check readability
* Prefer a horizontal bar when labels wrap or overlap.
* Limit pie charts to a small number of meaningful parts of one whole.
* Use grouped bars for a small number of comparison series.
* Use stacked bars when composition matters more than exact individual values.
* Add a table when the reader needs exact values or bases.
* Verify the base and filters regardless of display type.
## Check the result
The display matches the measure, labels remain readable, and percentages use an appropriate denominator. Reopen the saved chart and inspect its export before delivery.
## Related
* [Build and organize charts](/analysis/charts-library)
* [Build a crosstab](/analysis/crosstabs)
* [Choose and configure question types](/building-your-study/question-types)
* [Export results](/analysis/exports)
## Before you start
Choose the question and any breakdown first. Decide whether readers need composition, comparison, or exact values.
## Compare the available types
| Type | Use it for |
| ------------------ | ---------------------------------------------------------------------- |
| **Bar** | Comparing answer values with short labels |
| **Horizontal bar** | Comparing values when labels need more horizontal space |
| **Pie** | Showing a small number of mutually exclusive parts of a total |
| **Grouped bar** | Comparing a small number of breakdown series side by side |
| **Stacked bar** | Comparing the composition of answer categories across items |
| **Metric** | Presenting one numeric result prominently |
| **Table** | Reading exact counts and percentages, with or without crosstab columns |
Bar, horizontal bar, and pie are available for many questions without a breakdown. Grouped and stacked bars require a compatible breakdown. Numeric and matrix questions can make additional types available.
## Turn a table into a crosstab
**Table** with no breakdown is a frequency table. Add a question under **Break down by** and the same configuration becomes a crosstab with column bases and significance controls. Remove the final breakdown to return to a frequency table.
Use a table for exact values and an appendix-style view. Use a crosstab when the analysis asks whether results differ between defined columns.
## Preserve a generated chart type
Charts created in a report can include types such as Matrix, Star Chart, Box Plot, or Ranking that are not offered in the standard Charts picker. A chart with a reusable specification can be saved to the library and edited.
Changing one of these generated charts to a standard type can remove the option to return to its original generated display. Duplicate or save a separate copy first when the original must be retained.
Some computed report visuals have no reusable chart specification and therefore cannot be saved. Build an equivalent chart manually when you need a controlled, editable version.
## Check readability
* Prefer a horizontal bar when labels wrap or overlap.
* Limit pie charts to a small number of meaningful parts of one whole.
* Use grouped bars for a small number of comparison series.
* Use stacked bars when composition matters more than exact individual values.
* Add a table when the reader needs exact values or bases.
* Verify the base and filters regardless of display type.
## Check the result
The display matches the measure, labels remain readable, and percentages use an appropriate denominator. Reopen the saved chart and inspect its export before delivery.
## Related
* [Build and organize charts](/analysis/charts-library)
* [Build a crosstab](/analysis/crosstabs)
* [Choose and configure question types](/building-your-study/question-types)
* [Export results](/analysis/exports)